

Rules of Thumb for Reopening
Part 3: Who was that masked man?
[To streamline this post, we have focused on a few key steps in the analysis; for further technical details, click on the “In the weeds” links that are interspersed below.]This week’s post will focus on face masks. Given that the Center for Disease Control (CDC) recommends six feet of separation between unmasked people, we have been asked to consider the following questions: Should this distance be adjusted when one or both parties are masked? What impact do masks have on R0? And how do masks compare to other forms on PPE such as face shields?
The physics of droplets
There appears to be emerging consensus that viral particles which are transmitted through the air are spread via minute droplets that are emitted when we speak or exhale. Hence, in order to quantify the impact of masks, we first need to understand the fog of potentially contagious droplets surrounding an infected person.
In this analysis we will consider asymptomatic people only; a sneeze can release hundreds of millions of viral particles into the air at hundreds of miles per hour in which case all bets are off. However, under normal breathing conditions, each exhaled tiny droplet slowly settles under gravity while diffusing away from the infected person. These two effects — settling and diffusion — can be used to address the key question in determining the shape and extent of the droplet cloud, namely: how far does a droplet diffuse before it hits the ground?
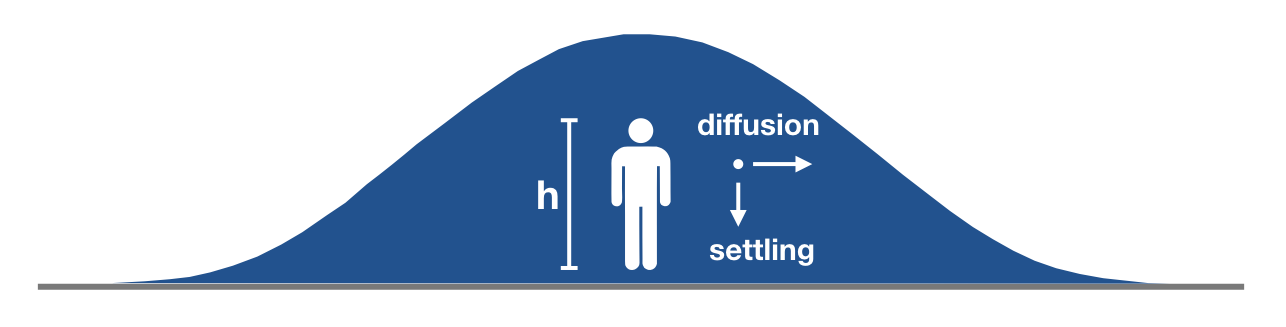
The settling velocity (a.k.a. terminal velocity) VS of small droplets is well-known, and is set by a balance between gravitational forces and the drag force from the surrounding air. This velocity along with the height of the source can be used to estimate the settling time (tS = h/VS) where parameters such as the viscosity of air, the density of the droplet, and critically, the droplet radius R, are reflected in the settling velocity VS.
The distance a droplet diffuses, x, within this settling time is set by the effective diffusivity D [In the weeds]. To estimate the value of D, we can model the droplet as a random walker that is wafted through the air with a characteristic step size set by typical indoor air currents. Putting all of this together, we find that the distance a single droplet diffuses is inversely proportional to the radius of the droplet: x ~ 1/R; i.e. large droplets settle quickly and smaller droplets travel farther before they are deposited on the ground.
Reconstructing the cloud
Now that we know approximately how far a single droplet carries, we turn our attention to clouds of exhaled droplets. Since large droplets settle fastest, the only ones left in the air a distance x away from the source are those smaller than R(x) ~ 1/x. If the distribution of droplet sizes can be reasonably well-approximated as p(R), then the number remaining in the air at x, is given by the cumulative distribution function of p(R) from 0 to R(x).
To find the concentration at x, we distribute the number droplets remaining in the air around a circle of radius x which gives us our desired estimate for the (dimensionless) concentration of droplets [In the weeds] in the air around a contagious (asymptomatic) person:
![]()
With this expression, we now have all of the pieces in place to estimate answers to the questions posed at the beginning of this post.
Implications: Reducing R0
Having gone through several months of social distancing, we are all intimately aware of the painful but essential steps that are required to reduce R0; this gives us ample motivation to address the question: how many of those hard-earned gains could have been achieved through masks instead?
It is widely accepted that an infection occurs when the number of viral particles (“virions”) inhaled by a susceptible person exceeds a critical number, N0. As a person (HealthyAlice) goes through her daily routine, she comes into contact with these virions which accumulate with every infected contact (longer contacts lead to more virions); hence the probability that she becomes infected is approximately:
![]()
where N is the number of virions that HealthyAlice has absorbed and the approximation holds for small N/N0. If HealthyAlice comes into contact with ContagiousBob, the number of viral particles she is exposed to is approximately c(x)T where x is the distance between them and T is the duration of the contact.
Now suppose ContagiousBob is wearing a mask. The number of droplets in ContagiousBob’s exhaled cloud is reduced by his mask which filters out some fraction of the droplets. The effective filtration β of different mask materials was recently measured and, to first order, reduces the number of emitted droplets by a factor of (1-β). This decreases the probability of HealthyAlice becoming infected by a factor of (1-β); furthermore, if HealthyAlice also wears a mask, the probability of infection drops by an additional factor of (1-β). Since this factor applies to all mask-wearing contacts in the population, the effective R0; for a masked population decreases by a factor of (1-β)2 relative to an unmasked population:
R0(masked) = R0(unmasked) x (1-β)2
To put some numbers to this, a 2-layer, well-fitted cotton (80 TPI) mask has been measured to filter out 38% of droplets. If the entire population wears these masks, the effective R0 drops by a factor of (1 – 0.38)2 = 0.38. For a similar 600 TPI cotton mask, β = 82% and R0 drops by a factor of (1 – 0.82)2 = 0.03. To put this in context, R0 for Covid-19 prior to social distancing has been estimated to be somewhere between 3 and 6; after social distancing we are now (hopefully) slightly under R0 = 1. This suggests that roughly 50-100% of those hard-earned gains could have been achieved with the adoption of cheap cotton masks.
Implications: How close is too close?
At this point we also have all the pieces we need to adjust the CDC recommended minimum distance to account for the use of masks. First, the recommended distance from an unmasked person x0 (e.g. 6 feet), corresponds to a concentration of droplets, c(x0) (which is presumably a level of concentration that the CDC finds acceptable). Now consider the case where the source (i.e. the infected person) is masked. To find the associated minimum recommended distance away from a masked source we need to invert the following expression to find the distance x0m at which the concentration of droplets from a masked source is equivalent to the concentration at x0 around an unmasked person:
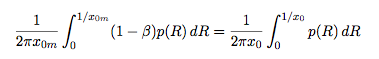
At this point, in order to evaluate this expression, we need to make some assumptions about p(R), the distribution of droplet sizes in the cloud. Although there are many references available, we were unable to divine any clear consensus about the details of the distribution (likely owing to the enormous challenges in measuring droplets at the small end of the spectrum in vivo). Despite this uncertainty in the composition of the cloud, it appears that mean droplet sizes are very roughly on the order of tens of microns and the variance of drop sizes is typically large. (Accounting for evaporation, the droplets rapidly become droplet “nuclei” and the mean size decreases further to a few microns [In the weeds]). In the limit of very large variance, we can roughly approximate the probability distribution p(R) as uniform, which makes evaluation of the integrals above trivial. In that case, the recommended distance criterion reduces to a simple rule of thumb
![]()
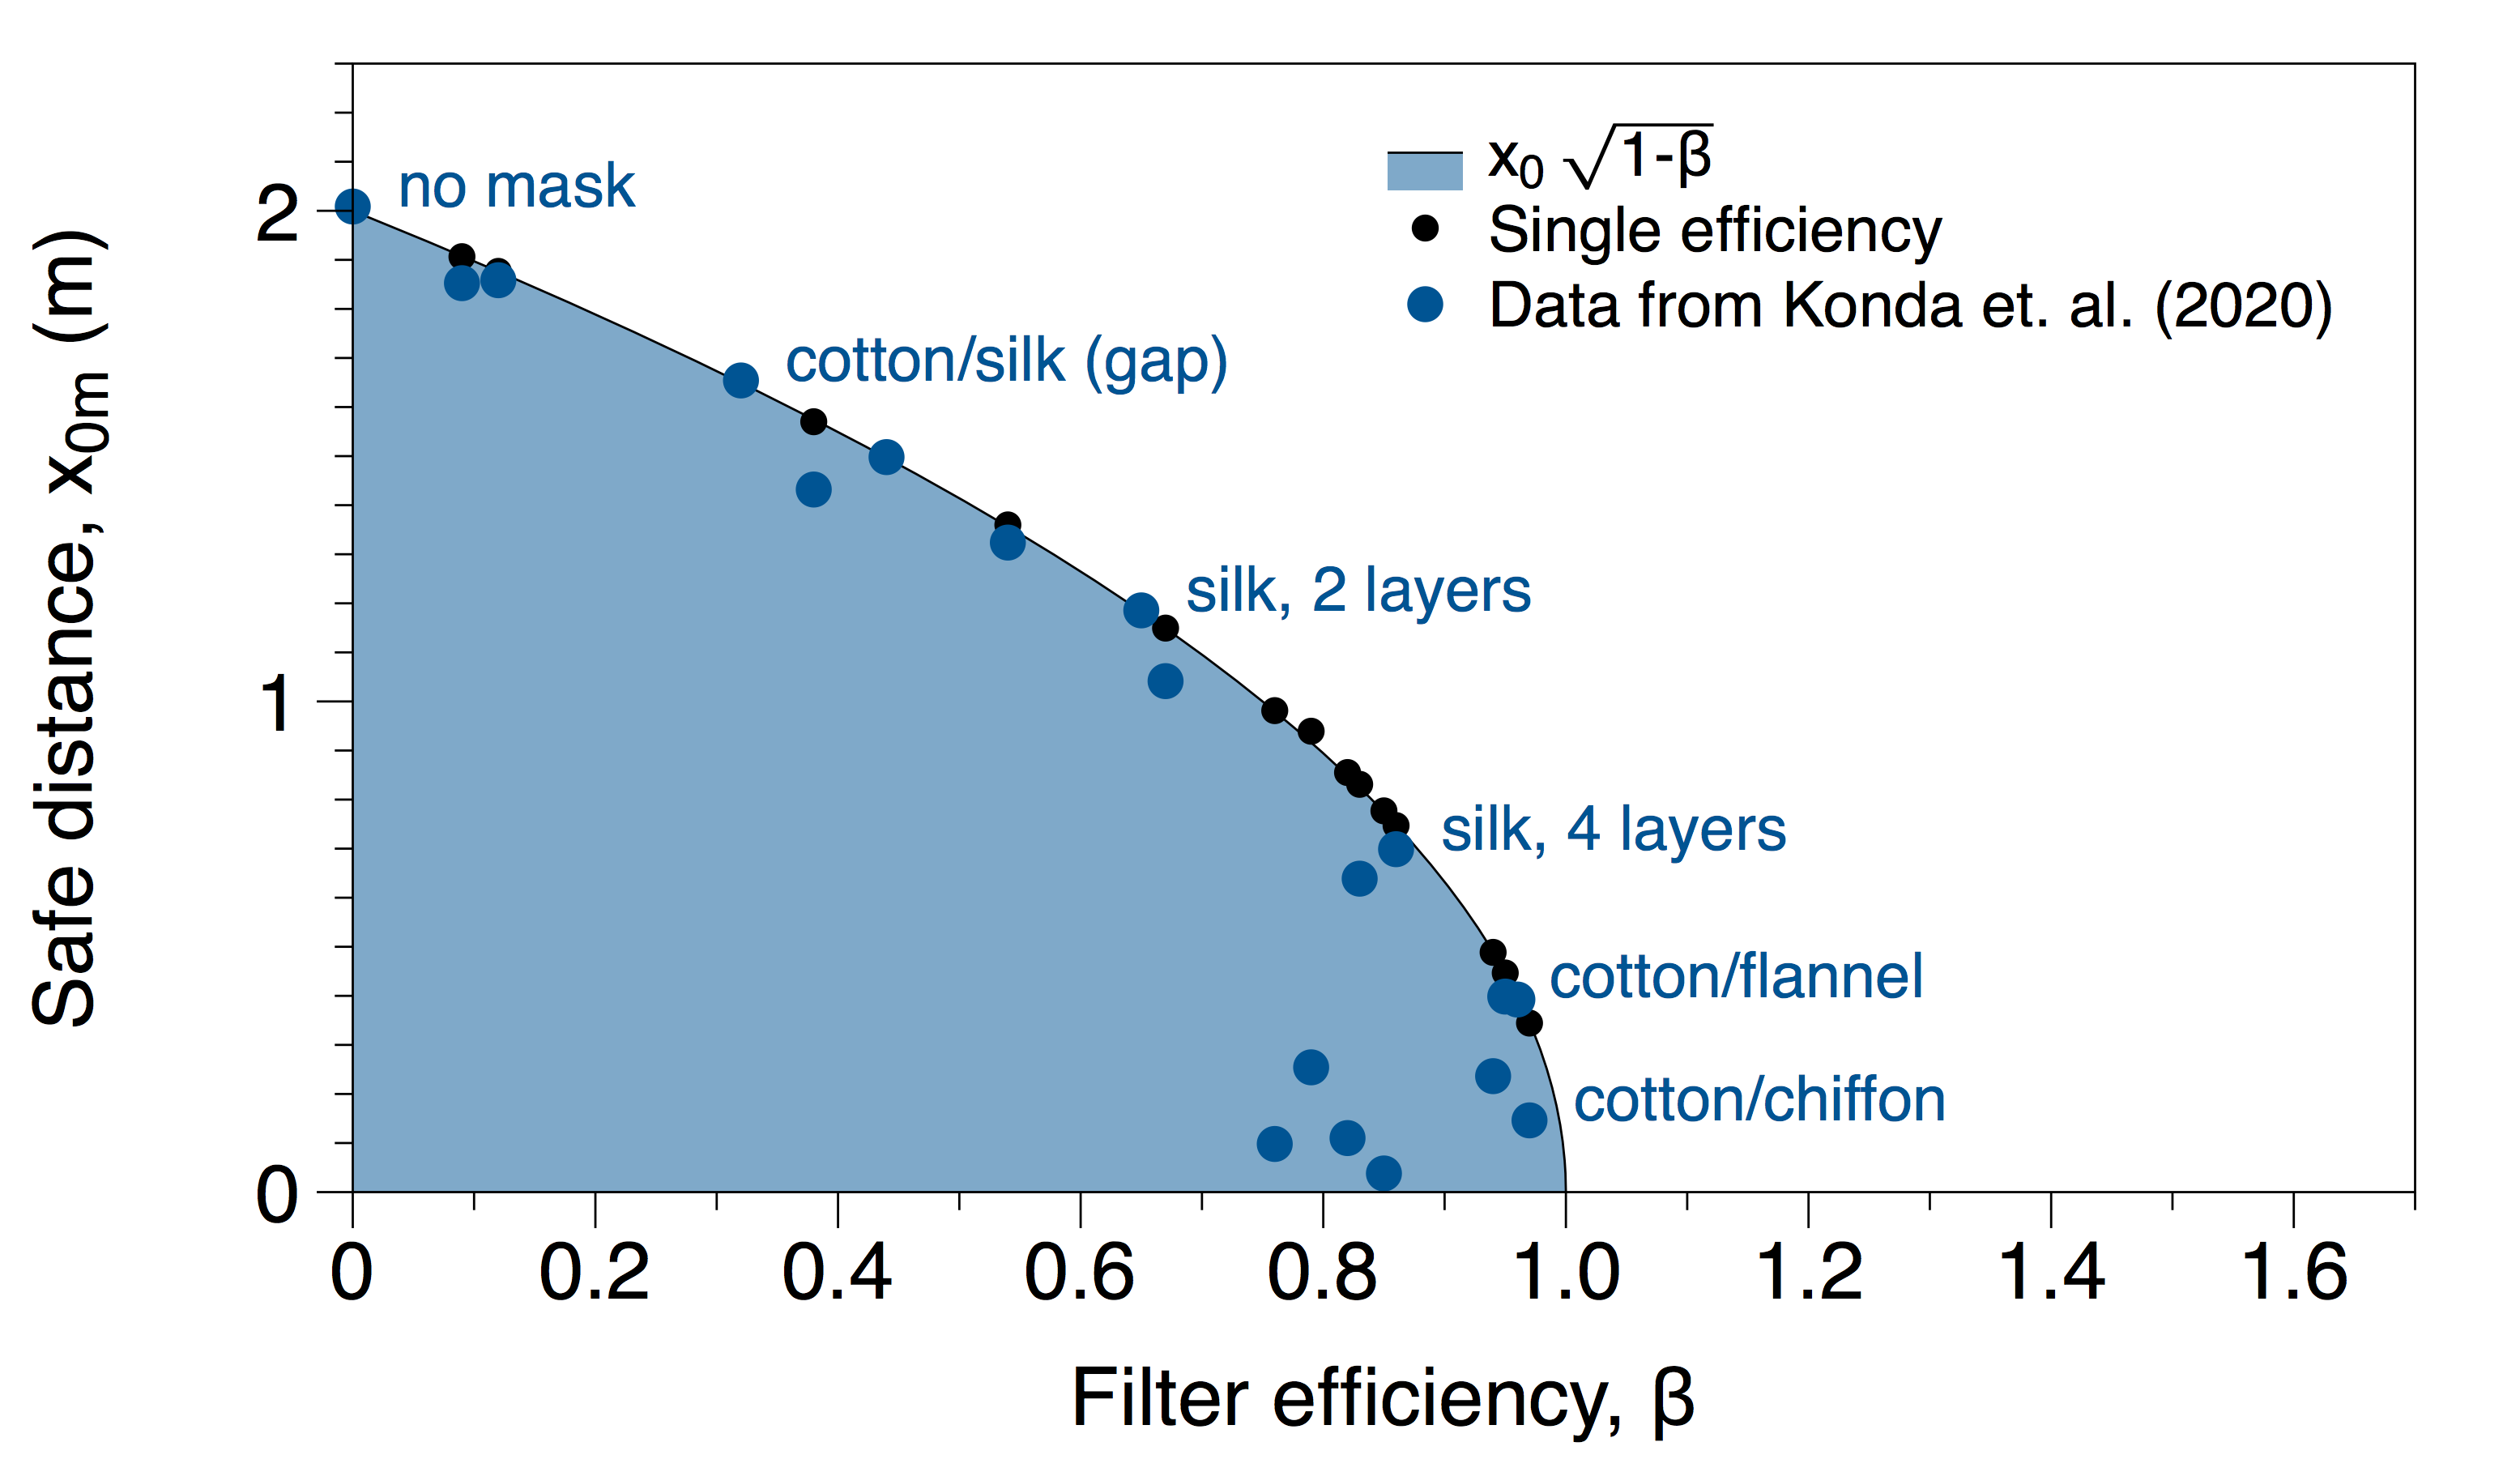
Namely, to estimate an amended recommended distance with a mask, multiply the CDC recommendation without a mask by the square root of one minus the efficiency of the mask. For example, the Konda et al paper referenced above measures the efficiency of a 2-layer cotton (600 TPI) mask to be 99.5% for particles greater than 0.3 microns and 82% for particles less than 0.3 microns. Taking the worst case scenario (i.e. the smaller β) we can estimate a revised distance for 2-layer cotton masks as:
x0m = (2 m) x (1 – 0.82)1/2 = 0.8 m
It is worth noting that this calculation does not require any direct assumptions about safe levels of concentration, size of air currents, height of people etc. Because our estimate is a relative calculation, all of those details are hidden in x0. I.e. If we believe that x0 is an acceptable distance without a mask, then we can use that quantity as a baseline to compute distances associated with equivalent levels of exposure for individuals wearing masks. Finally, we note that, if the efficiency β is not a function of droplet radius R, the adjustment is the same whether the source or the receiver is wearing the mask. If both are masked, then the correction is multiplicative: x0m = x0 (1 – βsource) 1/2 (1 – βreceiver)1/2.
Estimates for x0m (if one person is masked) for all of the materials measured in Konda et al. are shown in the plot below. The black points are the results using the worst case efficiency for each mask (as we did in the 2-layer cotton example above). The blue points show the integral calculation accounting for both efficiencies (above and below 0.3 microns). As expected, all of the blue points lie below the worst case estimate curve (i.e. the more detailed calculation allows for closer distances than the more conservative role of thumb estimate).
Implications: Applying this to face shields
Regarding face shields, it is important to begin by noting that the air flow (and hence the droplet dispersal) around face shields is not the same as that of masks. Face shields rely on inertia to propel the droplets onto the shield and under normal breathing conditions, the inertia of the droplets is quite low [In the weeds]. This is consistent with recent measurements that show that face shields reduce the transmission of aerosols by only 23%. (Compare this with coughing or sneezing events where the effectiveness of face shields has been measured to be as high as 96%). However, despite their differences, if effective β’s under asymptomatic conditions are known, then those β’s can be used in the analysis above to estimate reductions in R0 and recommended distancing for face shields and other PPE.
Finally, we conclude by re-emphasizing a few important caveats. First, all of these estimates assume tight, properly-worn, well-fitted masks. Improperly worn masks that allow the droplets to go around the edges and bypass filtration, defeat the purpose of the mask. Second, we should reiterate that this analysis is relevant for asymptomatic people. Coughing and sneezing dramatically changes the fluid dynamics and there has already been extensive excellent work on this topic. Our analysis should not be applied to scenarios in which the source is symptomatic (although masks certainly help in that case as well). Third, all of these estimates hinge on knowing x0, i.e. on the belief that the CDC’s recommendation of six foot separation is appropriate; our adjustment is only as good as the trusted baseline.
For further details please contact: Munzer Dahleh, Peko Hosoi, Simon Johnson, Ron Rivest, Emma Tegling, Ferran Vidal.

