

Modeling the growth phase of the COVID-19 spread at a county-level
When there is sufficient testing capacity and prioritization, the confirmed coronavirus case counts can be a useful indicator of the spread of the COVID-19 in a population. The availability of case count data at the county-level in the U.S. allows us to examine the growth phase of the spread by location. We postulate a growth phase model of the form n(t) = exp(at^2 + bt + c), where n(t) is the number of confirmed cases in the region up to day t. In this case, the “flattening” of the curve would correspond to the trend becoming sub-exponential, or in other words, the coefficient a being negative. Adopting a curve-fitting approach similar to before, we can ask the question: For which counties do we believe the curve has become sub-exponential (with 99% confidence), and for these counties, what is the time to plateau? (If a is negative but very close to zero, the curve has barely started flattening, and the plateau is going to be farther out in the future.)
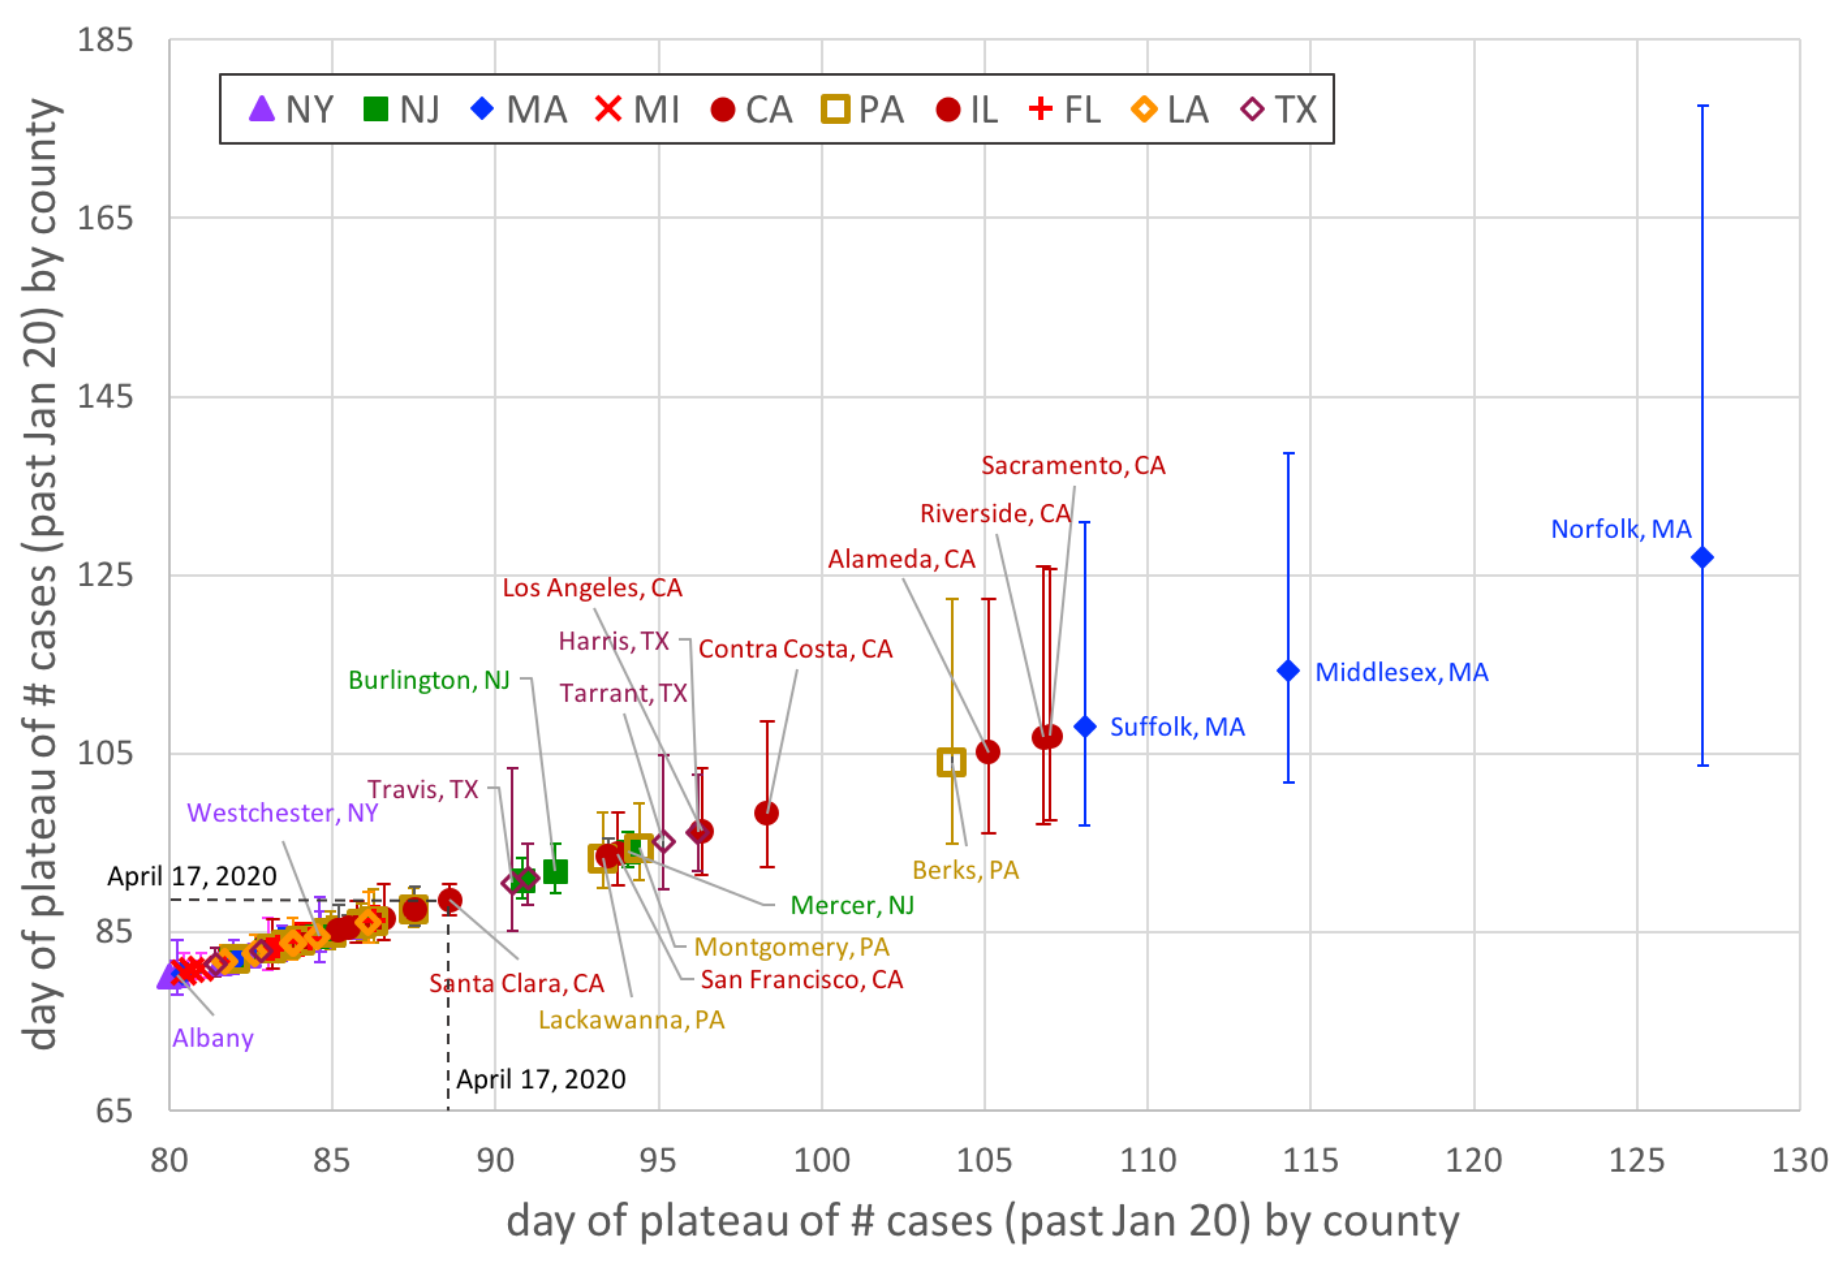
Mean and 95% confidence intervals of the estimated apex (time-to-plateau) for counties in the 10 states with the highest COVID-19 case counts. Only counties with at least 500 confirmed cases are shown. We note that all counties in New York (NY) state have reached their apex in terms of the spread, while several counties in Massachusetts (MA) and California (CA) are yet to reach their peak. It is worth pointing out that over the next month, many parts of the US will have reached the peak, even as others (including the most-populous counties in South Dakota and Nebraska) remain on an exponential trend.
We can also consider the differences between counties in the same state. We see that Norfolk, Middlesex, and Suffolk counties have a longer time to plateau than the other counties in MA. They also have the largest case counts among the counties in the state. A closer look shows that these neighboring counties are three of the four most populous and densest counties in the state, and rank at the highest level in the Rural-Urban Continuum Code. Based on initial inspection, we believe that considering the influence of geography, population density, demographics, and mobility can provide insights into the spread of COVID-19 at a location.
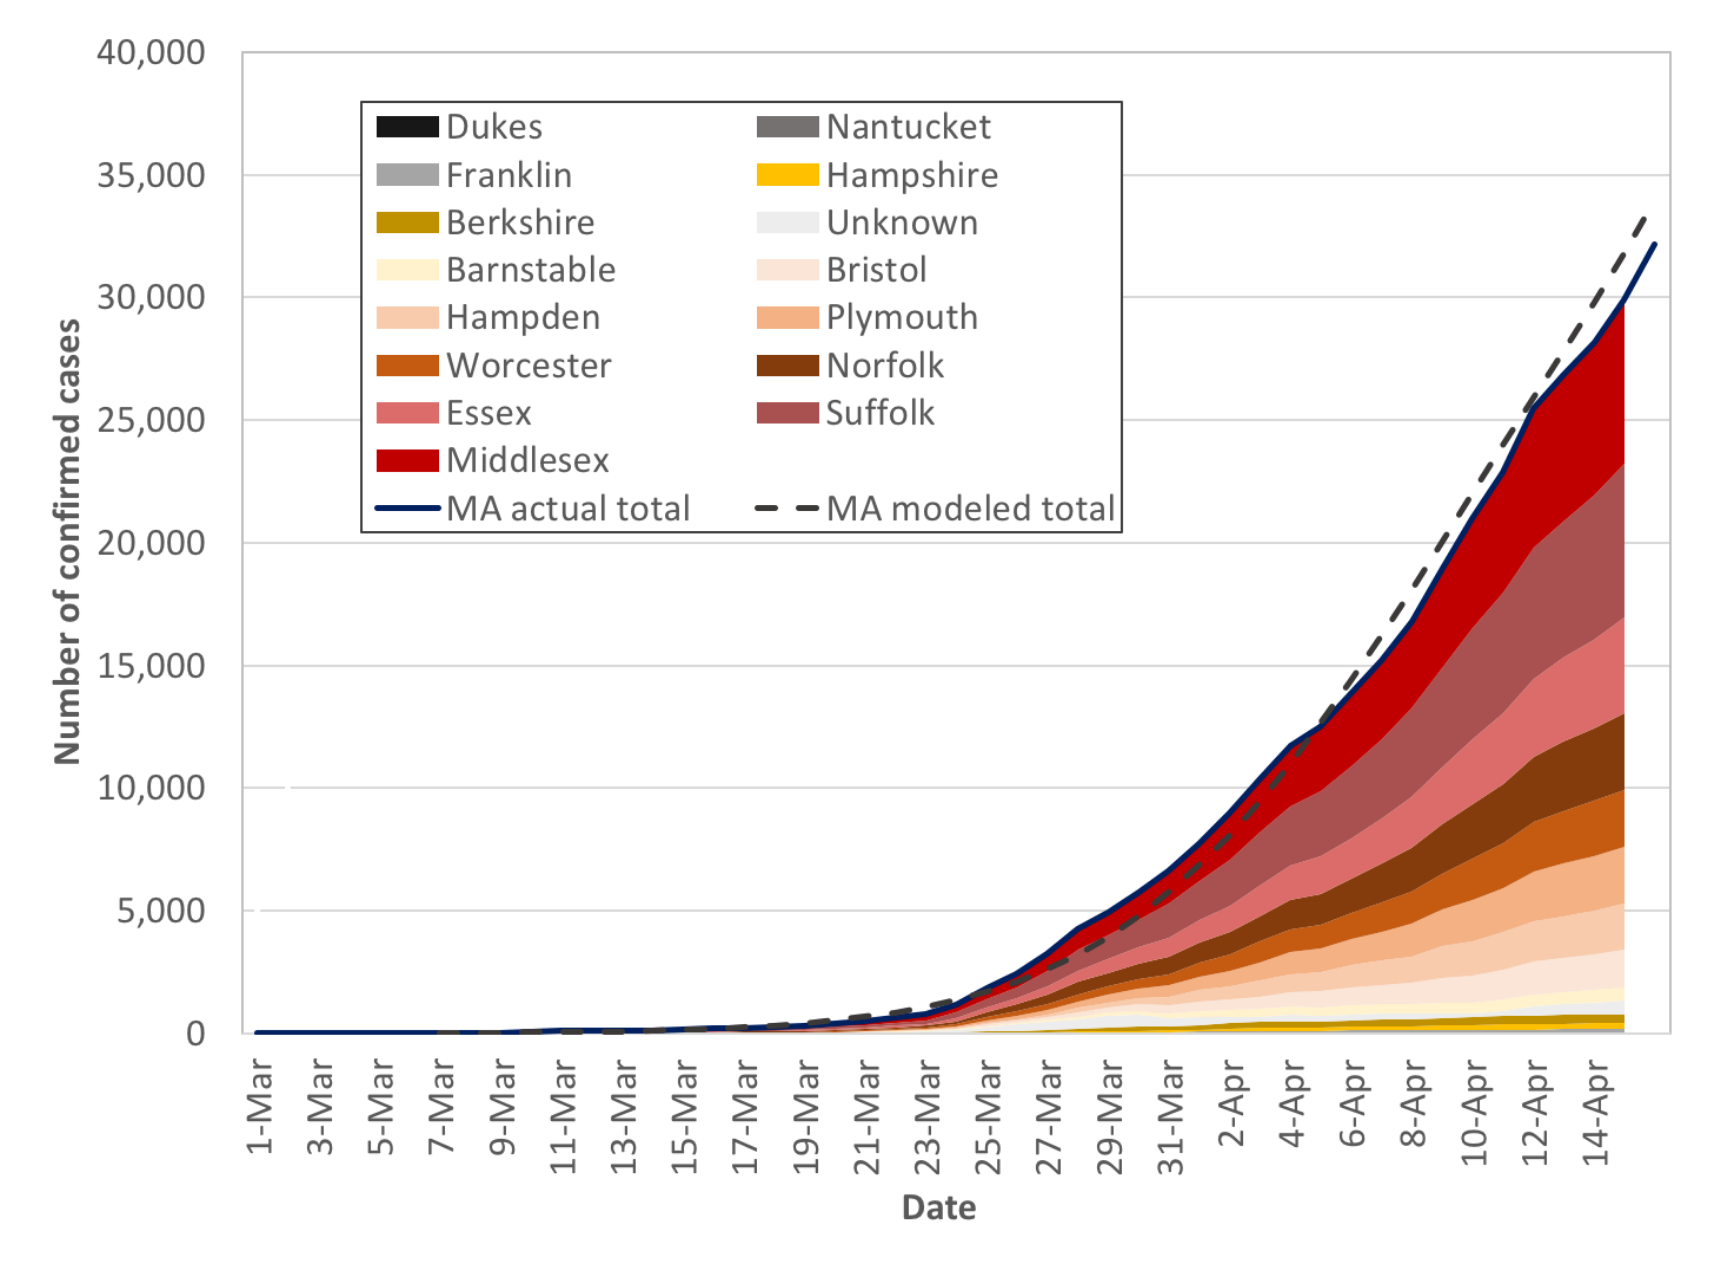
Evolution of confirmed COVID-19 case counts in MA by county, since March 1. The shaded areas correspond to the reported case counts for each county by date, and the solid black line corresponds to the total case count for MA. Several counties (Dukes, Nantucket and Franklin counties) have too few confirmed counts to be visible. The dotted black line is the sum of the modeled values for each county (the exponential curve-fits from the previous section). Day 0 of the exponential model for a county is the last day on which the county had fewer than 10 confirmed cases.
For further details, please contact: Hamsa Balakrishnan, Yash Deshpande, David Gamarnik, Peko Hosoi, Devavrat Shah

