

Are we flattening the curve? A statistical perspective
The spreading rate of Covid-19 is infamously exponential at the early stages of the epidemic, translating to doubling every 2.3 days in US (although varying region by region). However, classic epidemiology models suggest that the rate of growth itself depends on the number of incidences, and the rate declines as the number of incidences grow. With 90-95% of the US population under strict social distancing measures, have we flattened the curve? Do we see a decline in the exponential rate?
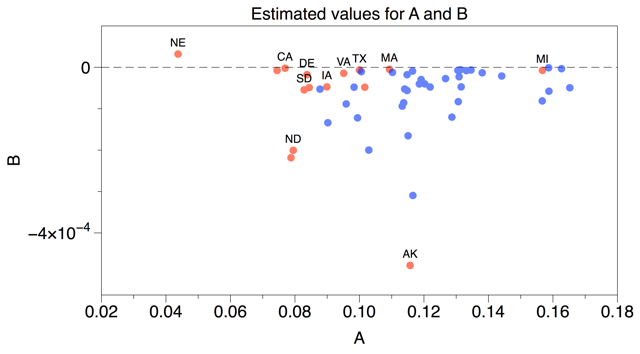
We develop a simple model to test which states in the US still see an exponential rate of growth, and for which ones we observe a decline. The model postulates the dependence of the form n(t+1)=n(t)exp(A-Bn(t)), where n(t) is the number of confirmed cases in the region up to date t. Exponential growth (status quo or null hypothesis) corresponds to setting B=0. A flattening, or decline of exponential growth (the alternative hypothesis) corresponds to B being positive. Using data made available by the New York Times, we estimated parameters A and B from the number of confirmed cases in 50 states and the District of Columbia. Our results show that while 35 regions demonstrate a clear decline in the exponential growth (B>0 with 99% confidence), the remaining 16 regions show numbers consistent with exponential growth. Similar computations for several states in India, including Maharashtra, Tamil Nadu and the national capital territory of Delhi, as well as India nationally, reveal that the states as well as the country are still on the exponential growth of incidences.
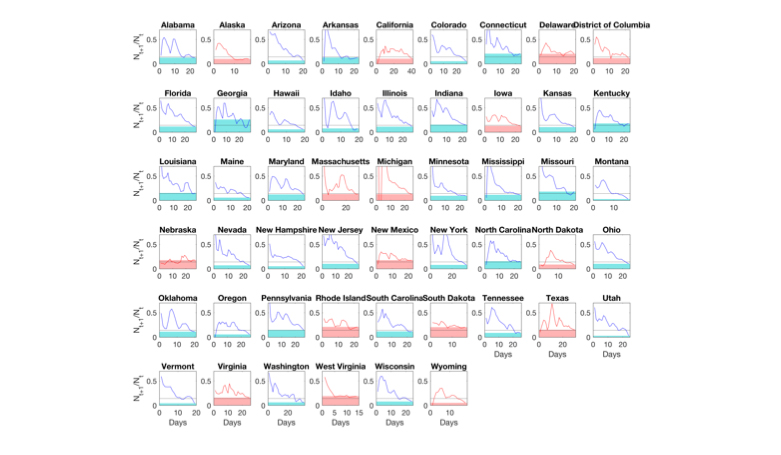
The graphs show the growth rate, in fractional terms, at which the disease is spreading state-wise. Plots are on a semi-log scale; exponential growth corresponds to a constant value (see e.g. Nebraska or South Dakota). Black dotted lines indicate 1/(7 days), i.e. the rate at which the number of reported cases doubles in a week. Blue curves indicate states in which the growth rate is sub-exponential as determined by the hypothesis testing method described above; red curves indicate states that are not sub-exponential. Time = 0 was chosen as the first day in which more than 20 cases were reported. Data was smoothed with a Savitzky-Golay filter before calculating the spreading rates.
For further details, please contact: Hamsa Balakrishnan, Yash Deshpande, David Gamarnik, Peko Hosoi

