

Rules of Thumb for Reopening
Part 1: Testing = Control
Widespread testing is essential in understanding the extent of covid-19, in predicting peaks in contagion, and in anticipating where the next hotspots will emerge; this information is critical in making decisions around deploying resources and preparing for surges in the health system. However, this is just the tip of the iceberg when it comes to the benefits of testing. The real potency of testing is not just in information, but in control.
One of the challenges with this virus is that a large number of carriers are “hidden” i.e. a significant fraction of the population is contagious but asymptomatic. Therefore we need strategies to deal with scenarios in which the agents spreading the disease may be unknown. To illustrate the power of testing in this context, imagine that you are an omniscient entity who has perfect knowledge of which of your citizens is infected and which are not. If you are a benevolent entity, you can easily shut down the spread of any virus by isolating people the instant they become infected. The reality is that we do not have perfect knowledge of who has the disease, but the more information we have, the closer we can come to the Benevolent Entity Solution (BES).
In the following, we will use a simple model to estimate the benefits of testing relative to other control strategies and quantify how close we can come to the BES. First, we note that the rate at which the virus spreads is proportional to the number of infected people who are wandering around the community (i.e. not isolated) as illustrated by the purple box in the figure below. In order to control the spread of the disease we need to limit the number of people in that box; the levers we have to control that number fall into two categories: 1) slow down the rate of people entering the box (via social distancing, improved hygiene, wearing masks, etc.) or 2) speed up the rate at which we remove people from that population (via testing + isolation).
A great deal of our collective societal efforts (particularly in the US) have focused on the first strategy, i.e. practicing social distancing to reduce R0 (the average number of people infected by one contagious person during the time of their infection). Here instead the emphasis will be on the second strategy i.e. isolating people form the community while they are contagious.
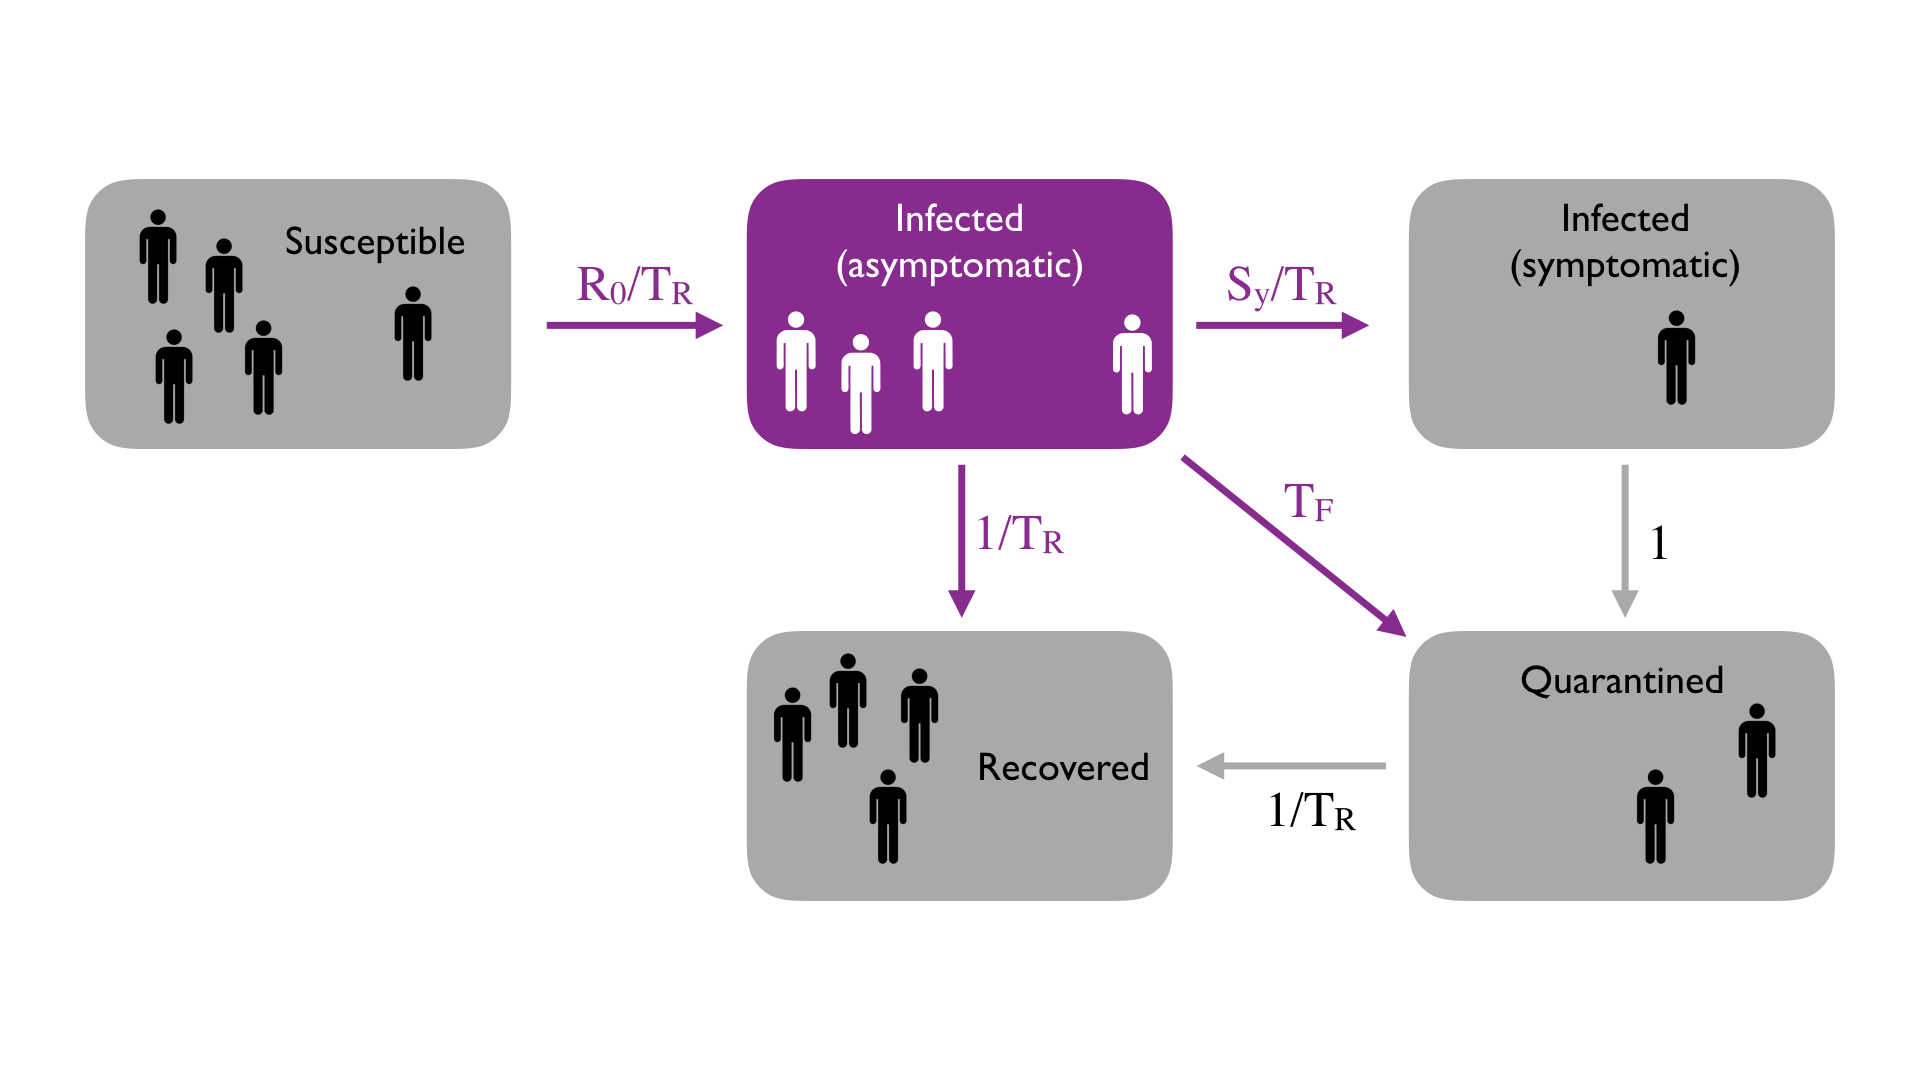
In order to roughly quantify this notion, consider a simple mean field approach to emulate the spread of the disease. In this representation, people move from box to box (in the figure above) as follows. For each day of the simulation:
- For every infected person who is not quarantined, randomly select N other people. For each of those people who are susceptible, roll a dice and they become infected with probability R0/(TRN); here TR represents the average recovery time in days e.g. ~ 20 days for covid-19.
- When a person first becomes infected, they are asymptomatic (i.e. they move into the purple box).
- From the purple box, there are three options:
- Roll a dice and with probability 1/TR the person recovers.
- Roll a dice and with probability Sy/TR they become symptomatic where Sy is the fraction of the infected population that develops symptoms; symptomatic people are immediately quarantined.
- Roll a dice and with probability TF they are tested; the test will reveal the infection and they are immediately quarantined.
What does testing buy us?
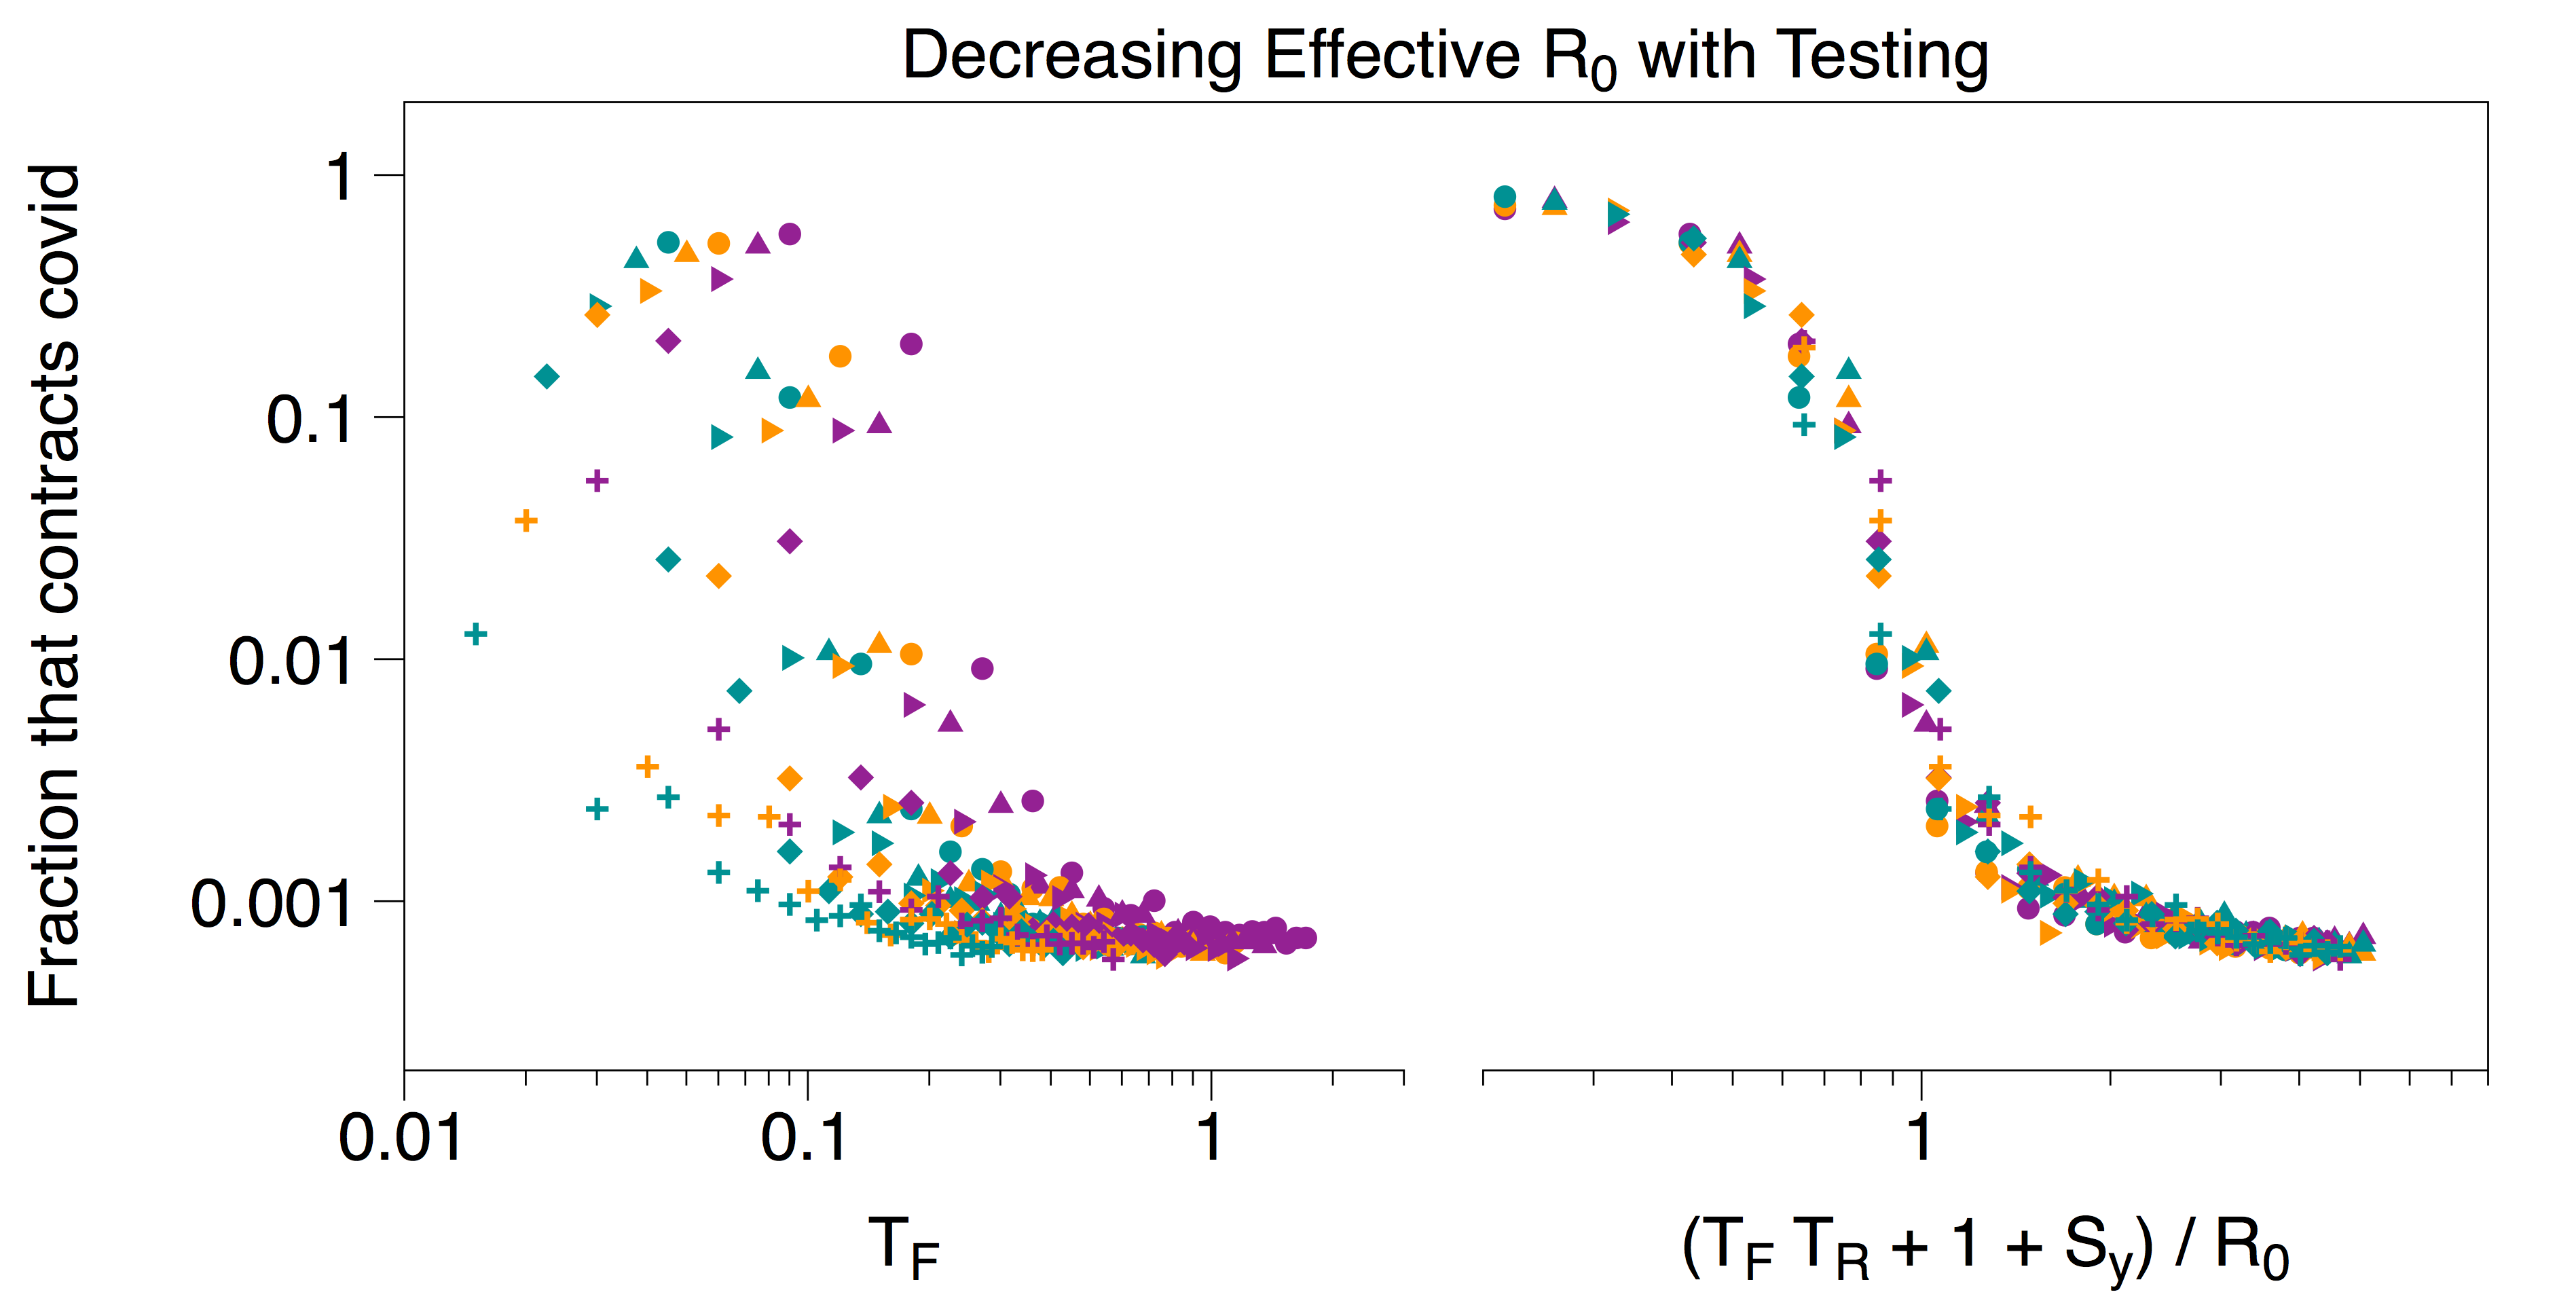
This mean field approach suggests a simple strategy borrowed from queuing theory to estimate the value of testing in controlling the spread of the virus. Essentially we need to balance (or reduce) the net number of people entering the purple box:
R0 / TR ≤ TF + 1 / TR + SY / TR.
The collapse of the data from the mean field model, rescaled using this relationship is shown in the plot below; color represents different values of RT (14 [purple], 21 [orange], and 28 [teal] days); shape represents different values of R0 (2, 3, 4, 5, 6).
At a practical level, this balance provides a measure of the value of testing relative to other mitigation strategies. Rearranging and considering a parameter regime where TFTR >> 1 + Sy, yields the simple heuristic relationship:
R0 / TFTR ≤ 1
which provides a rough estimate of the direct trade-off between social distancing and testing — namely increasing testing (increasing TF) allows for less stringent social distancing requirements (increasing R0) without violating the inequality (i.e. keeping the spread of the virus contained).
For further details please contact: Munzer Dahleh, Peko Hosoi, Dalton Jones

