

Real Time Mixture-Based Predictions
Mixtures in Data
The spread of COVID-19 hasn’t limited itself to a single community: the virus has splintered itself around the globe, with each community having a unique response to the virus.
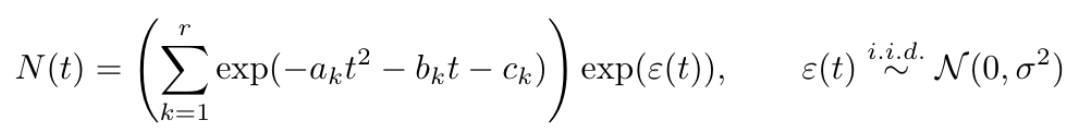
In the post Mixtures Matter, we discussed a statistical method for predicting key COVID-19 quantities such as number of cases or deaths in particular regions. Specifically, we looked at the following class of functions to model observations:
In words, the above equation says that the metric of interest can be explained by the sum of several Gaussian curves, where each curve represents a particular “outbreak.” For example, the following plot shows a fit of the number of cases in the United States as a sum of two Gaussian curves:
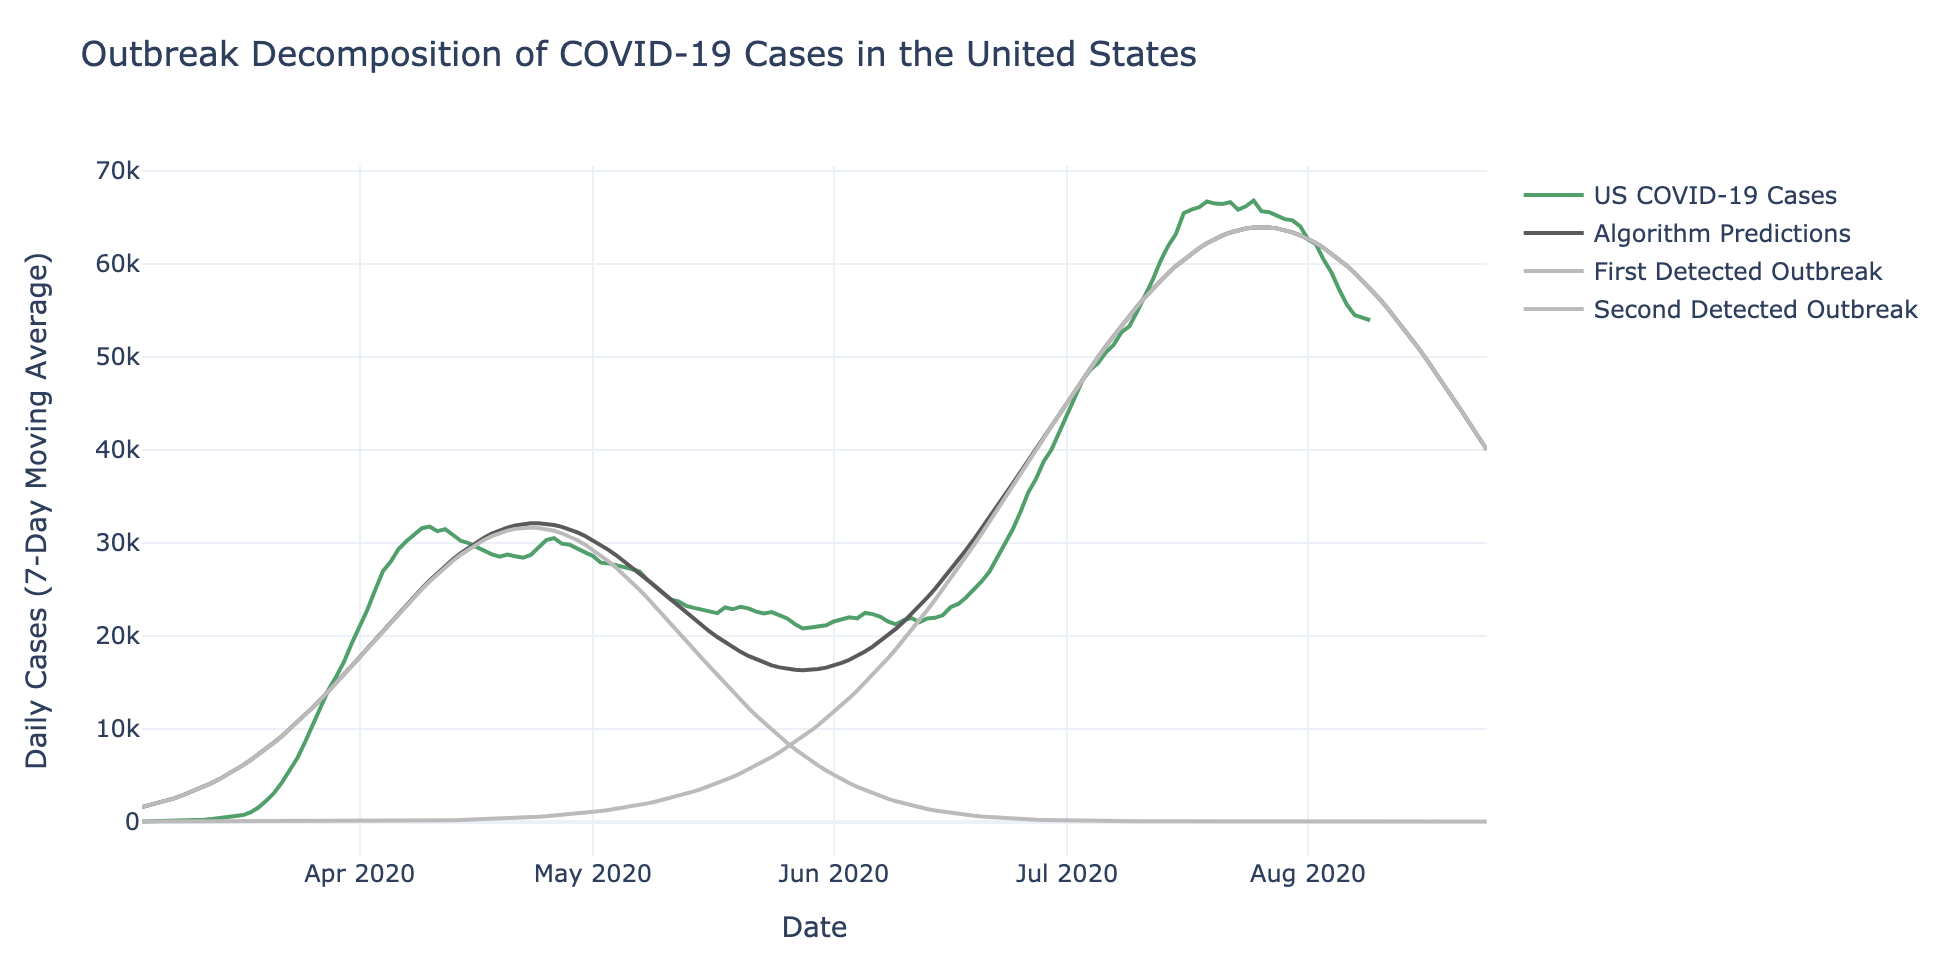
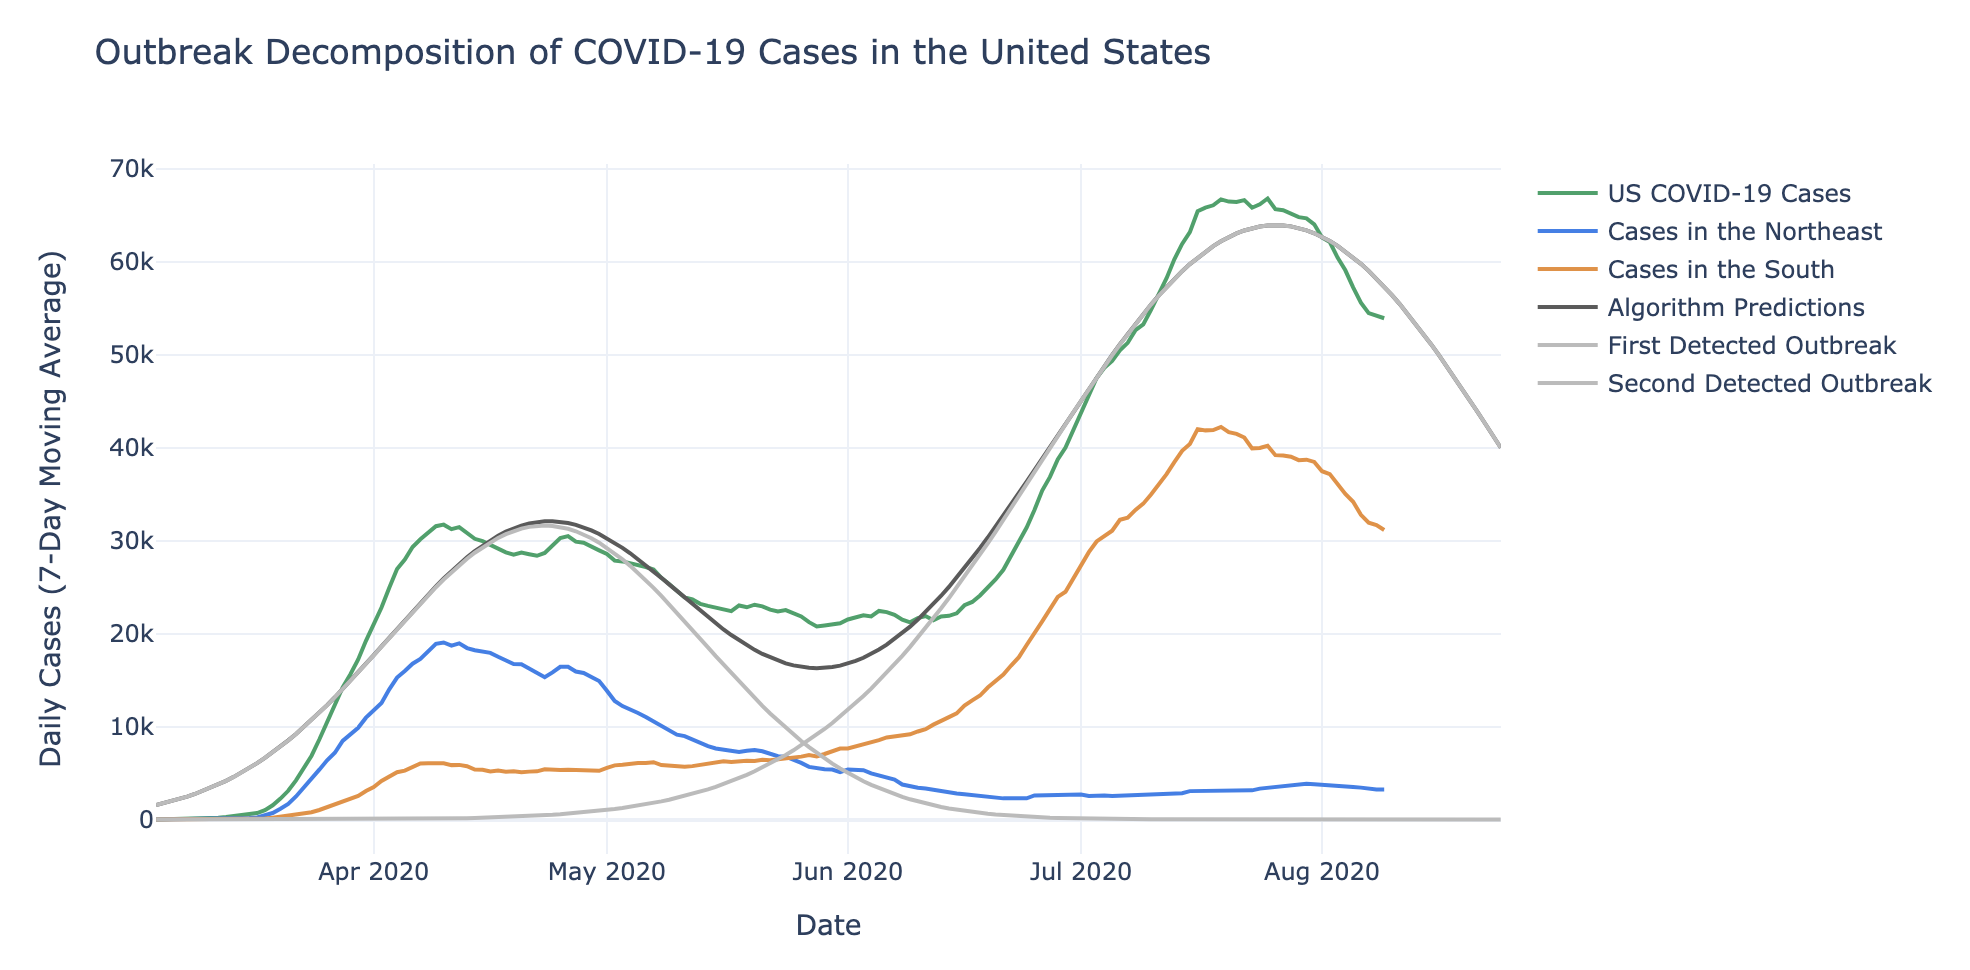
In particular, the identified “outbreaks” seem to correspond with a first wave of infections being dominated by case counts in the Northeast, and a second wave of infections dominated by case counts in the South, as can be observed in the following plot.
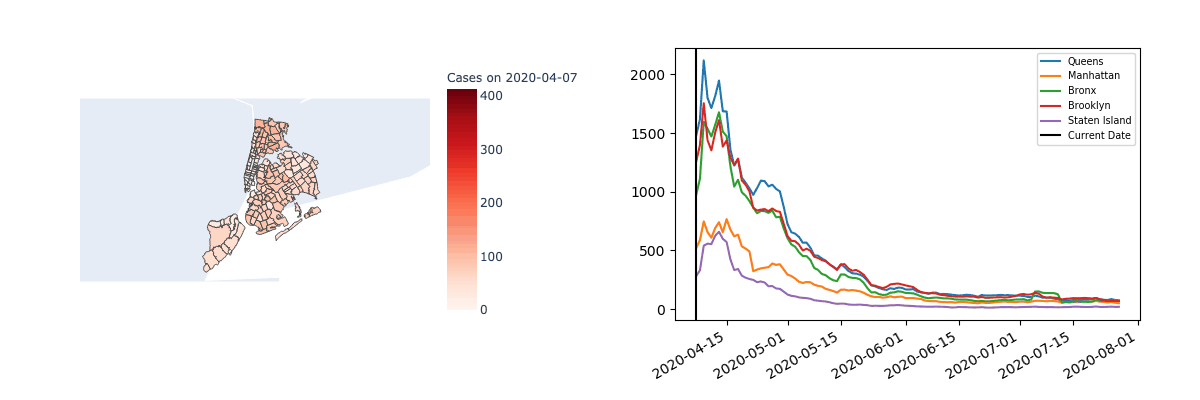
It’s also interesting to note that mixtures are only meaningfully found in time series data when there’s enough separation between the regions. For example, the following visualization suggests the case counts in each zip code of New York are highly correlated.
Endogeneity and the Lucas Critique
While statistical methods are useful and often used for short-term predictions, it is worth noting that this approach of predictions based on curve fitting makes the assumption that data in the past can be used to predict future results.
In particular, this implies that our curve-fitting method will not automatically account for the endogeneity of how COVID-19 spreads, making it susceptible to the Lucas Critique. This critique, which originates in the macroeconomics literature, says that any predictions about a change in policy can not strictly rely on historical data. For example, our curve fitting methods cannot be used to inform how cases might increase should schools reopen in the Fall.
A Real-Time Dashboard
To show the efficacy of our curve fitting method, we have created the following dashboard:
The purpose of this dashboard is to show how effective the considered class of functions can estimate COVID-19 cases and deaths. We outline a few features of the dashboard below.
Data
The dashboard imports data from the New York Times, and allows the user to select which region (either the entire United States or any particular state) and which metric (either number of cases or deaths) for prediction.
Backtesting
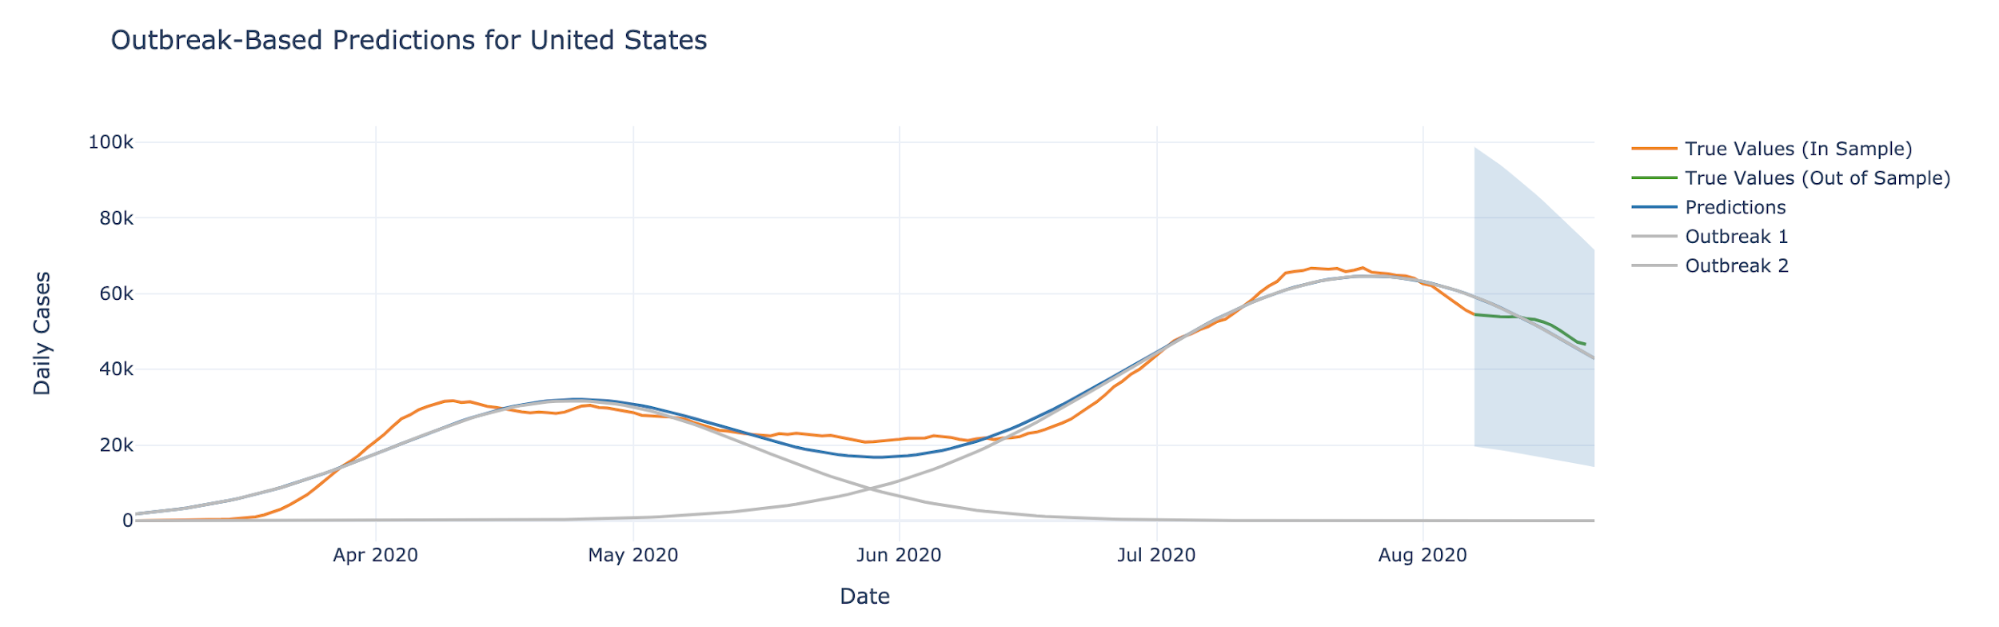
We include a feature which allows the user to backtest the algorithm and see how well predictions would have worked had the algorithm been trained up to a particular date. For example, the following plot shows the curve-fitting method applied to data prior to 8/7/2020, where the green curve represents data not “seen” by the algorithm. This results in a remarkable fit in the short term.
In contrast, we can also see how the Lucas Critique applies to the dashboard’s output in the long-term, by only using data up to 5/31/2020.
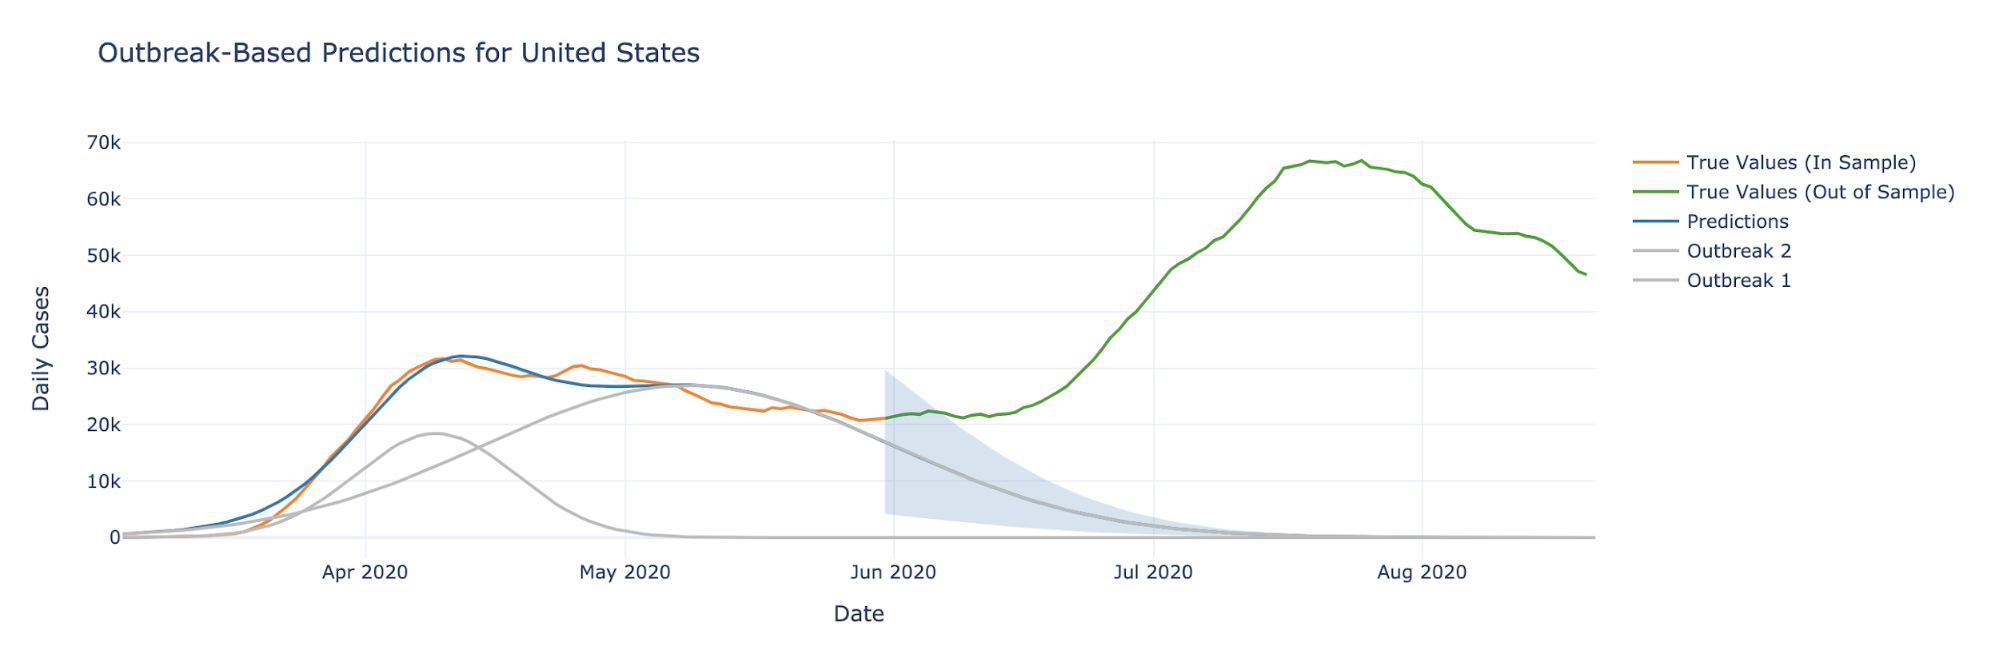
In this case, the predictions cannot account for the upcoming increase in cases, as there is another outbreak that is not seen in the data prior to June.
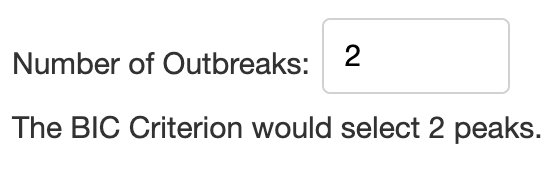
Since selecting the number of mixtures is an important feature of the model, we have allowed the user to input the number of desired mixtures. As a baseline, we include the number of mixtures the BIC criterion would select.
Prediction Intervals
In order to help quantify the uncertainty of our predictions, we include prediction intervals which are computed with the assumption that the logarithm of the number of cases is perturbed by independent Gaussian noise. Specifically, this implies that the observed time-series has the following form:
This allows us to quantify both the uncertainty of the magnitude of cases seen in the future, and the uncertainty of when the peak will occur in each particular outbreak.
Ultimately, we hope that this dashboard helps to provide both an idea of in what cases curve fitting is effective in short-term predictions, and how the COVID-19 pandemic could evolve if past data are indicative of the future.
For further details, please contact Ali Jadbabaie, Arnab Sarker, and Devavrat Shah.

