

Who Can Afford to Buy a Home in America?
By Megan Li (MSRP ’23 intern, Harvey Mudd College), Aurora Zhang (MIT Institute for Data, Systems, and Society), Peko Hosoi (MIT Institute for Data, Systems, and Society)
Background
Motivation. Owning a home is one of the most important ways of building wealth in America. As rises in home prices outpace rises in income, fewer and fewer Americans can afford to buy a home, causing the generational wealth gap to widen. Housing assistance programs are imperative to expand access to homeownership – particularly for Black Americans, who have historically been excluded from stable homeowning through policies and practices including redlining and exclusionary zoning.
Introduction. Designing effective housing assistance requires understanding where gaps in affordability currently exist for potential homeowners. Our study consists of two stages:
1. Using county-level data on income and housing prices, we quantify and visualize how affordability based on income alone varies across the United States.
2. By expanding our model of affordability to account for assets and debt, we determine the most common barriers to homeownership.
Methods
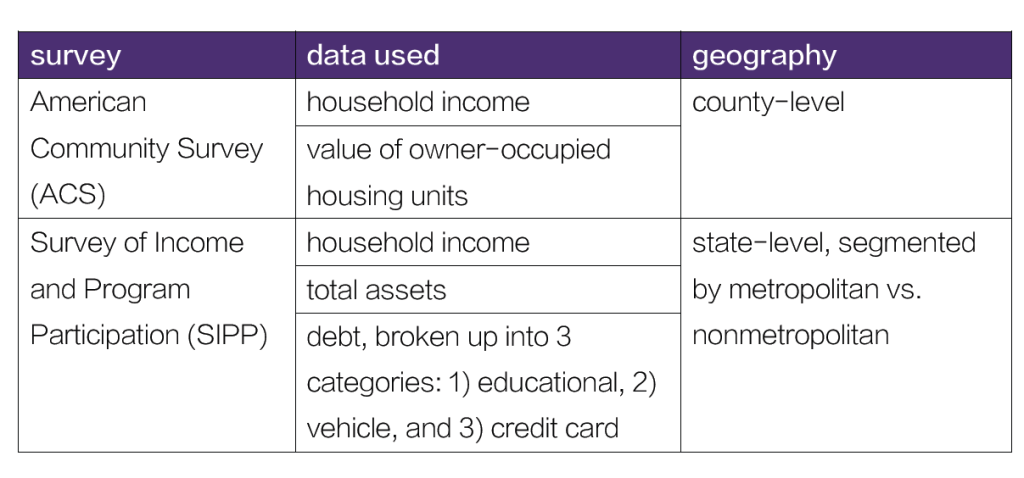
What data did we use? We used 2021 data from two surveys conducted annually by the Census Bureau.
What did we do with the data? For a household with given financial characteristics, we compute the maximum value of a home that they could afford.
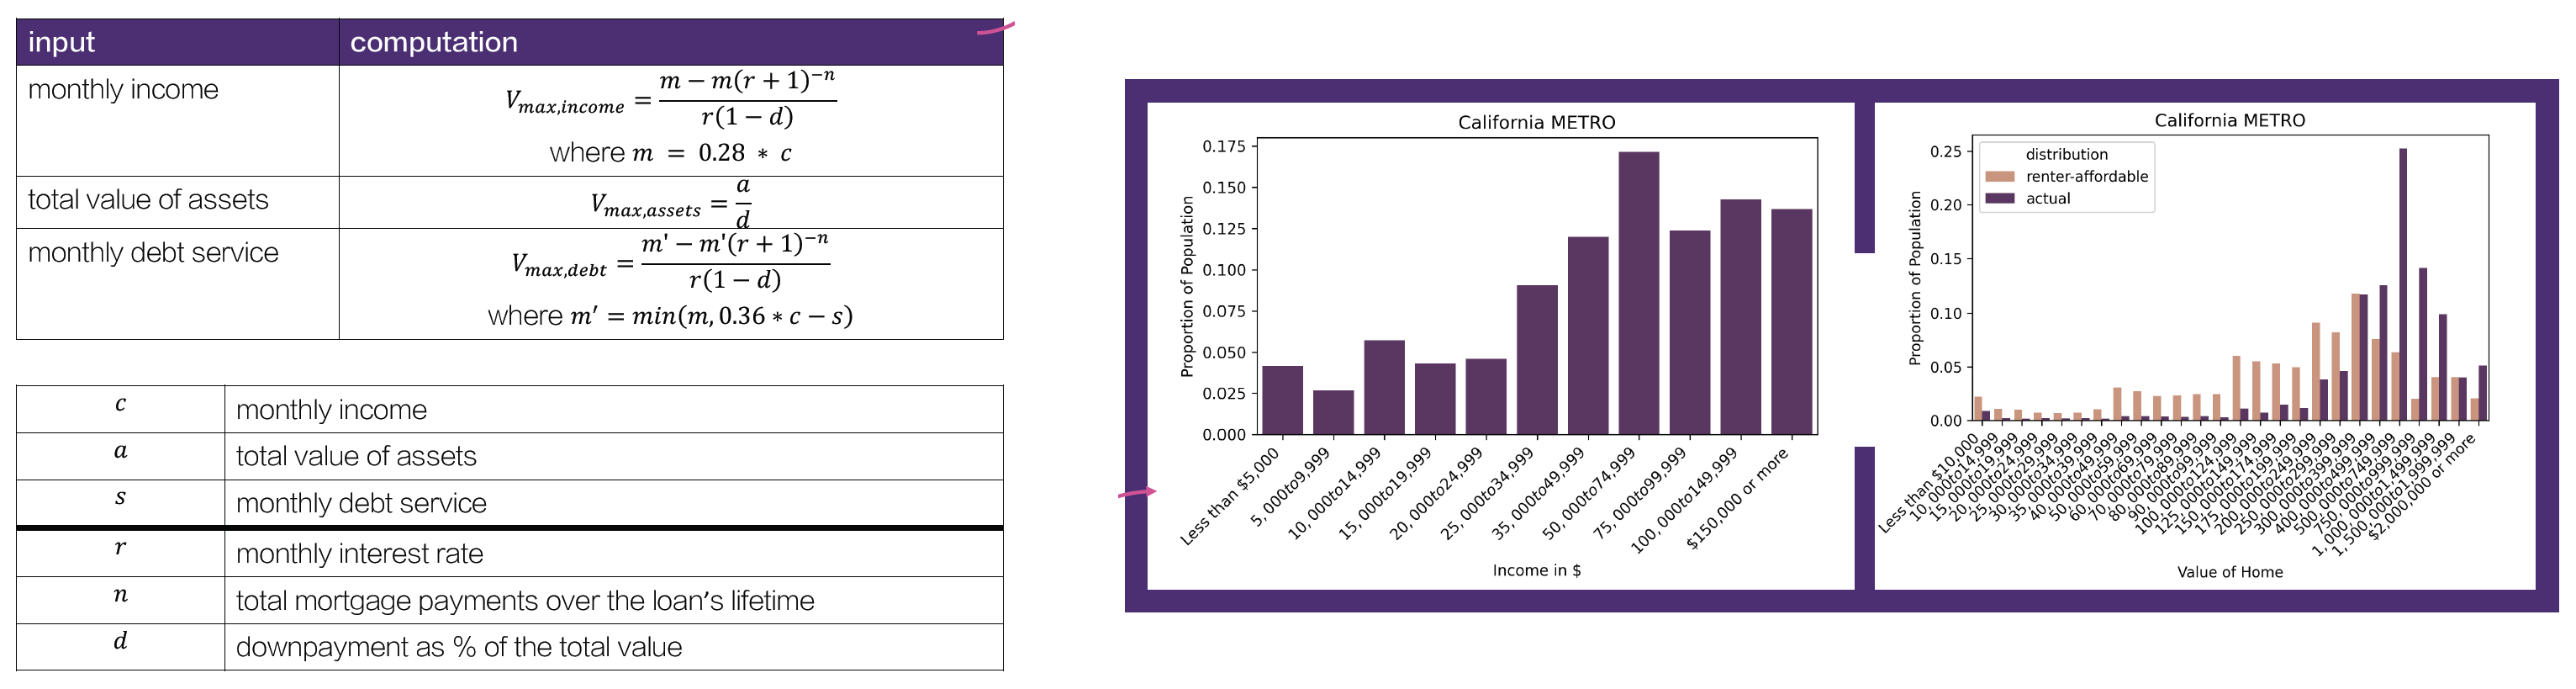
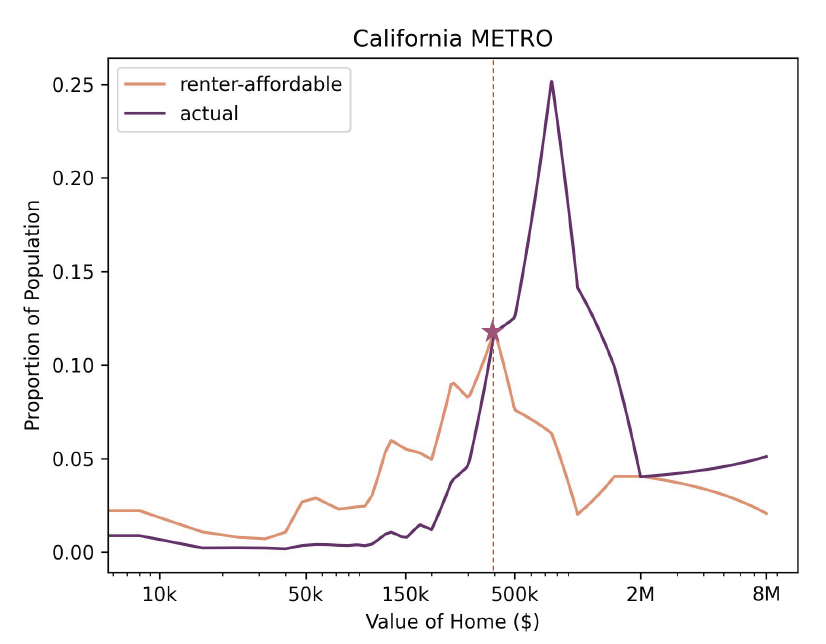
Given the distribution of income for renting households, we project a distribution of renteraffordable home prices and compare it against the distribution of owner-occupied (actual) home prices.
How do we quantify affordability? For each distribution of home values (renteraffordable and actual), we compute the cumulative density function (CDF) of the distribution. Then, our metric z is computed as
![]()
where F (x) and G (x) are the CDFs of the renteraffordable and actual home value distributions, respectively, and xcrit is the x-value of the intersection of the two curves with the greatest y-value (as pictured below). In plain English, this
metric quantifies the proportion of renters who are priced out of their housing market.
Results
1. Mapping Affordability Across the US
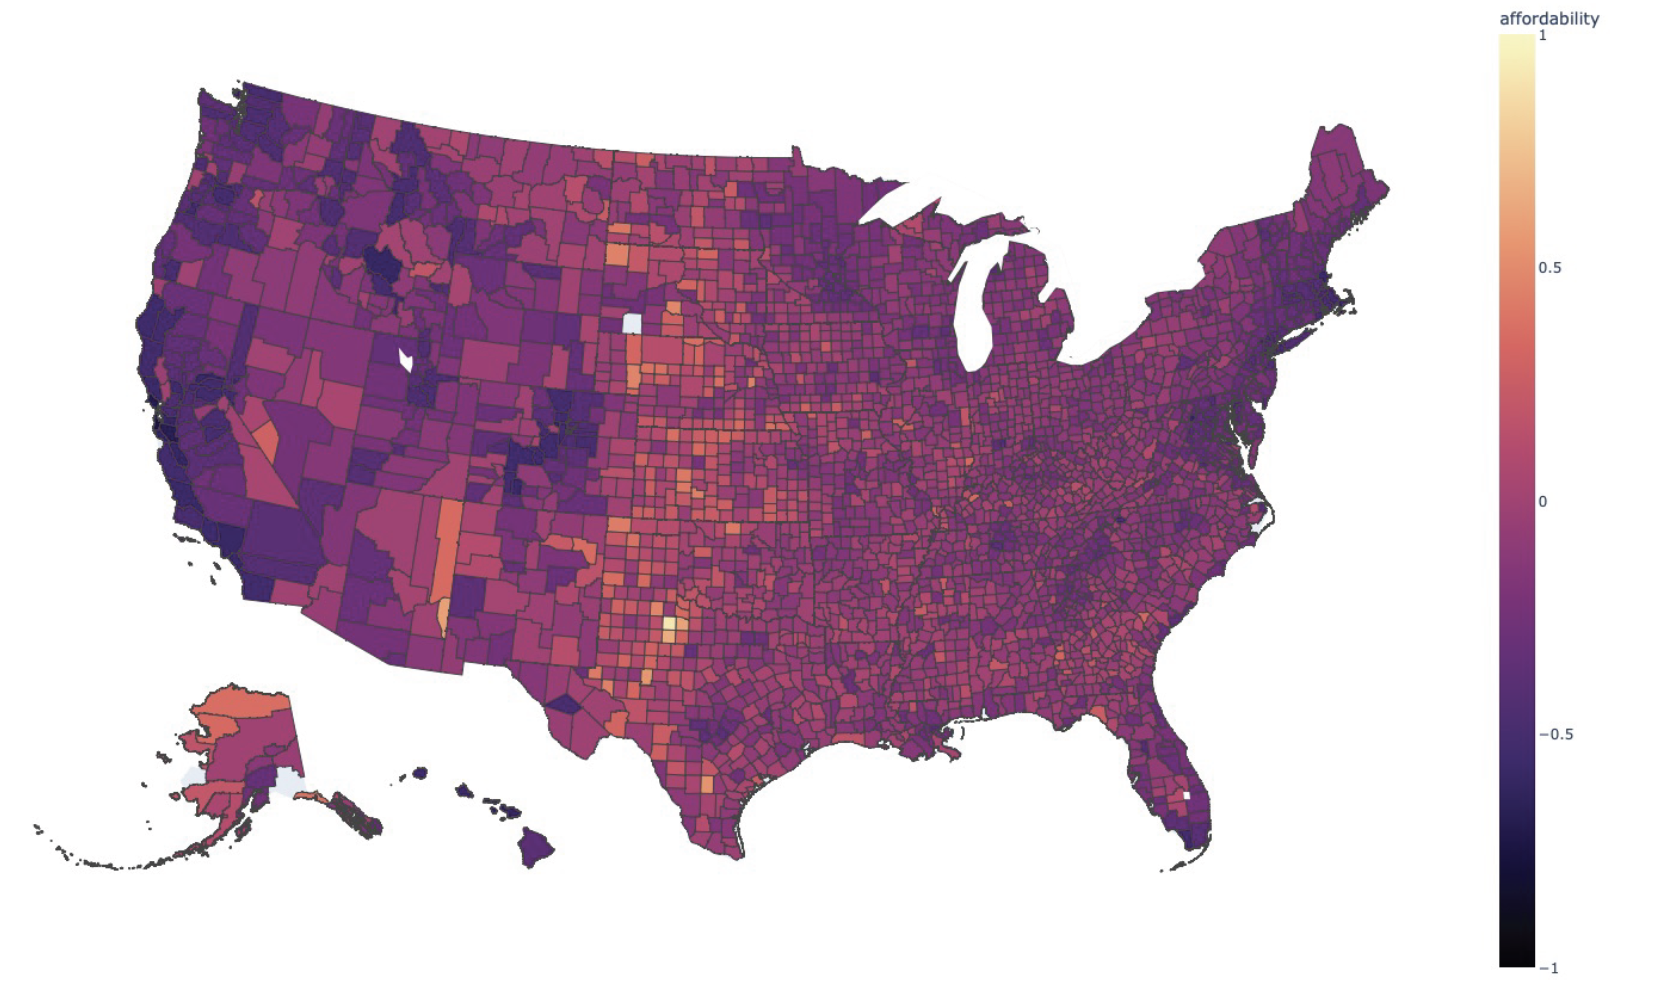
We created this heatmap of the United States by computing our metric of affordability z (based on renters’ household incomes) for each county in the US. A z-value close to -1 indicates that most renters in the area cannot afford to own a home, while a z-value close to 1 indicates that most renters in the area can comfortably afford to become homeowners. A z-value near 0 indicates that home values approximately match what is maximally affordable for renters in the area. That is, counties that are colored a deep purple have relatively unaffordable housing markets, while counties that are closer to orange or yellow have relatively affordable markets.
2. Determining Barriers to Homeownership
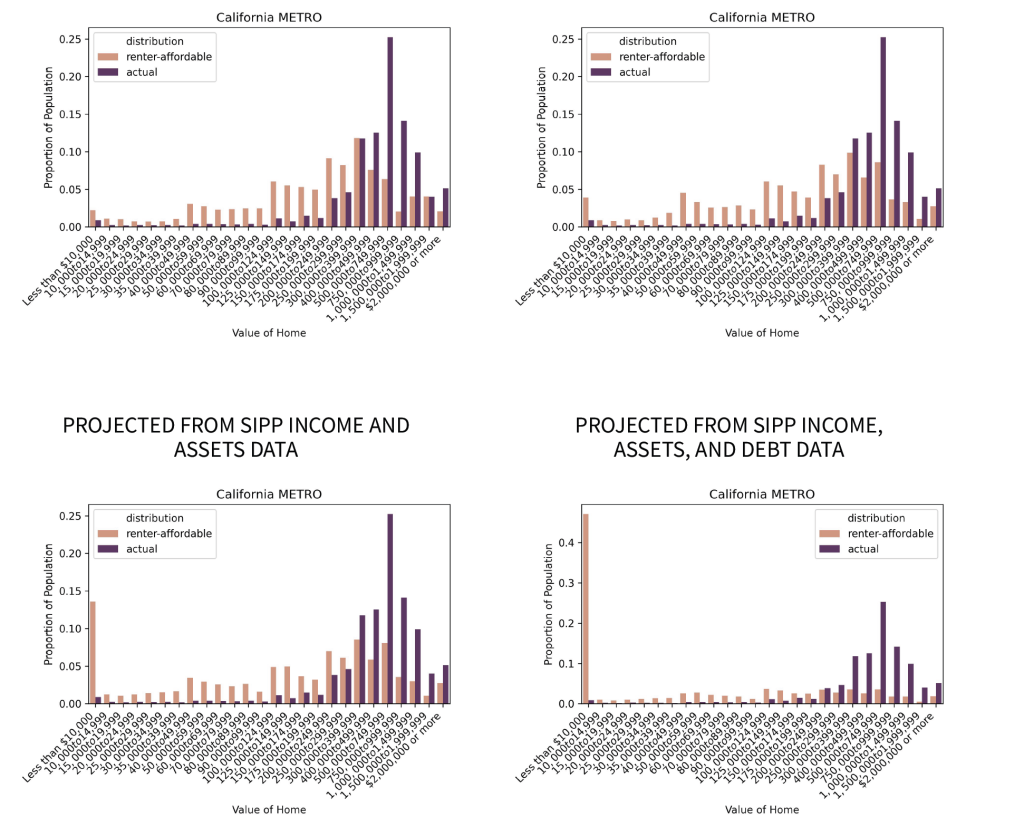
Using SIPP data, we expanded our model of affordability to include assets and debt. The result above allows us to draw conclusions about which financial constraints (insufficient income to make monthly mortgage payments, insufficient assets for downpayment, or unmanageable debt) are most often the barriers to homeownership.
Conclusions
- Based on income alone, renters in metropolitan areas – particularly those on the coasts– are less able to afford a home in their county than those in nonmetropolitan areas.
- Insufficient income is not the sole barrier to homeownership; rather, most renters are also constrained by insufficient assets and/or excessive debt.
- Our metric provides a framework with which we can measure not only affordability, but also variations in affordability over time, geography, or the
creation of assistance programs.
Next steps
- Existing housing assistance programs typically provide cash grants to help cover downpayments, but the efficacy of these programs in the current housing market is not well quantified.
- Result [2] suggests that debt forgiveness has great potential to increase the number of renters who could afford a home.
- More geographically detailed SIPP data would allow us to to increase the
geographic granularity of our expanded model of affordability.
References
1) Census Bureau. (2021). American Community Survey (2017-2021 5-year Release) [Data set].
https://www.census.gov/newsroom/press-kits/2022/acs-5-year.html
2) Census Bureau. (2021). Survey of Income and Program Participation [Data set].
https://www.census.gov/programs-surveys/sipp/data/datasets/2021-data/2021.html
3) Perkins, K. L., Rieger, S. M., Spader, J., & Herbert, C. (2020). The Potential for Shared Equity and Other Forms of Downpayment Assistance to Expand Access to Homeownership. Cityscape, 22(1), 147–186.
https://www.jstor.org/stable/26915492
4) Wilson, E., and Callis, R. (2013). Who Could Afford to Buy a Home in 2009? Affordability of Buying a Home in the United States. Current Housing Reports, May. Washington, DC: U.S. Census Bureau.

