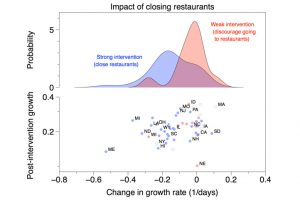
The Impact of Closing Restaurants
Over the past few weeks, states have taken a variety of different approaches to combat the evolving COVID-19 pandemic. These range from strong actions (e.g. close all bars and restaurants) to relatively mild responses (e.g. discourage people from going to restaurants). This graph shows how much the rate at which the disease spreads, changed in each state after restaurant-related interventions (x-axis). Blue corresponds to states with strong responses and red corresponds to states with more mild responses. On average, it appears that strong interventions are more effective in slowing the spread of COVID-19 as can be seen in the shift of the peak of the blue curve to the left.
For further details please contact: Peko Hosoi
(Data sources: https://github.com/nytimes/covid-19-data and https://www.nga.org/coronavirus/).


