Beyond Fairness: Reparative Algorithms to Address Historical Injustices of Housing Discrimination in the US
Abstract
Fairness in Machine Learning (ML) has mostly focused on interrogating the fairness of a particular decision point with assumptions made that the people represented in the data have been fairly treated throughout history. However, fairness cannot be ultimately achieved if such assumptions are not valid. This is the case for mortgage lending discrimination in the US, which should be critically understood as the result of historically accumulated injustices that were enacted through public policies and private practices including redlining, racial covenants, exclusionary zoning, and predatory inclusion, among others. With the erroneous assumptions of historical fairness in ML, Black borrowers with low income and low wealth are considered as a given condition in a lending algorithm, thus rejecting loans to them would be considered a “fair” decision even though Black borrowers were historically excluded from home-ownership and wealth creation. To emphasize such issues, we introduce case studies using contemporary mortgage lending data as well as historical census data in the US. First, we show that historical housing discrimination has differentiated each racial group’s baseline wealth which is a critical input for algorithmically determining mortgage loans. The second case study estimates the cost of housing reparations in the algorithmic lending context to redress historical harms because of such discriminatory housing policies. Through these case studies, we envision what reparative algorithms would look like in the context of housing discrimination in the US. This work connects to emerging scholarship on how algorithmic systems can contribute to redressing past harms through engaging with reparations policies and programs.
Authors: Wonyoung So (Department of Urban Studies and Planning, MIT), Pranay Lohia (Microsoft), Rakesh Pimplikar (IBM Research AI), A.E. Hosoi (Institute for Data, Systems, and Society, MIT), Catherine D’Ignazio (Department of Urban Studies and Planning, MIT)
This paper was presented at the conference FAccT ’22: 2022 ACM Conference on Fairness, Accountability, and Transparency
Fairness in ML: Have people of different groups represented in the data been fairly treated?
Housing in the US, absolutely not.
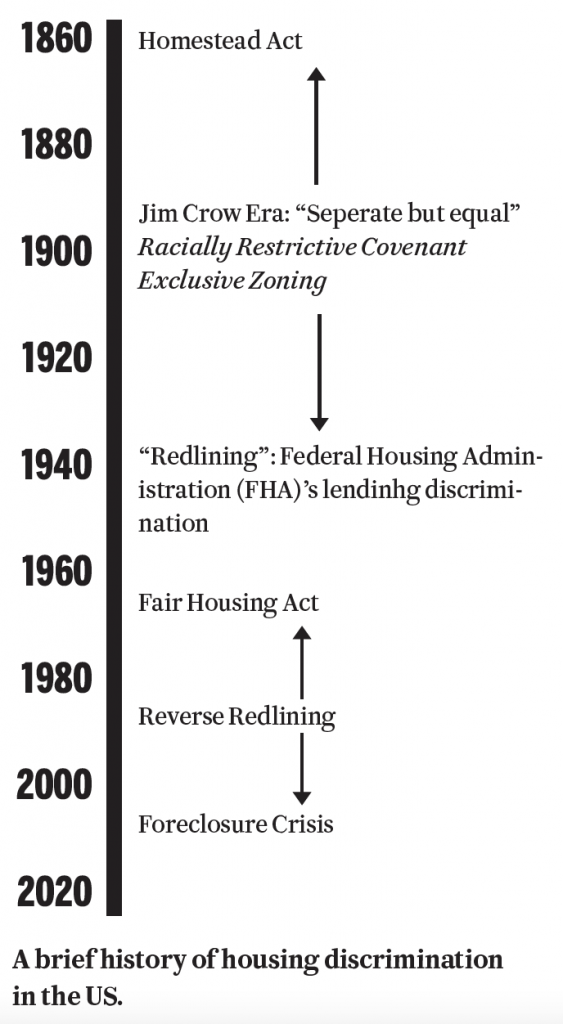
 The racial stratification created because of such historical discrimination fundamentally challenges the assumptions of fairness in ML by introducing historical bias into today’s decision-making points. Put simply, the base distribution of measuring creditworthiness by race, as shown in the bottom, has disparities by race and the reason can be attributed to historical discrimination which limited access to wealth accumulation through housing. Housing discrimination in the US is complicated with racism from private sectors and the history of state-sanctioned and institutionalized discriminatory policies, including redlining and exclusionary zoning, thus leading to residential segregation and targeted disinvestment in education and the built environment. We build on recent work on algorithmic reparation to argue that a reparative approach to developing an algorithmic process and/or system can contribute to redressing the historical harms that lead to deeply unequal base conditions in a decision-making or resource-allocation process.

Distribution of the loan-to-value ratio and debt-to-income ratio by applicant’s race. Source: Conventional first-lien mortgage applications of the 2020 Home Mortgage Disclosure Act (HMDA) data.
Reparative Algorithms
Study 1: Identifying Historical Bias Through Causal Inference

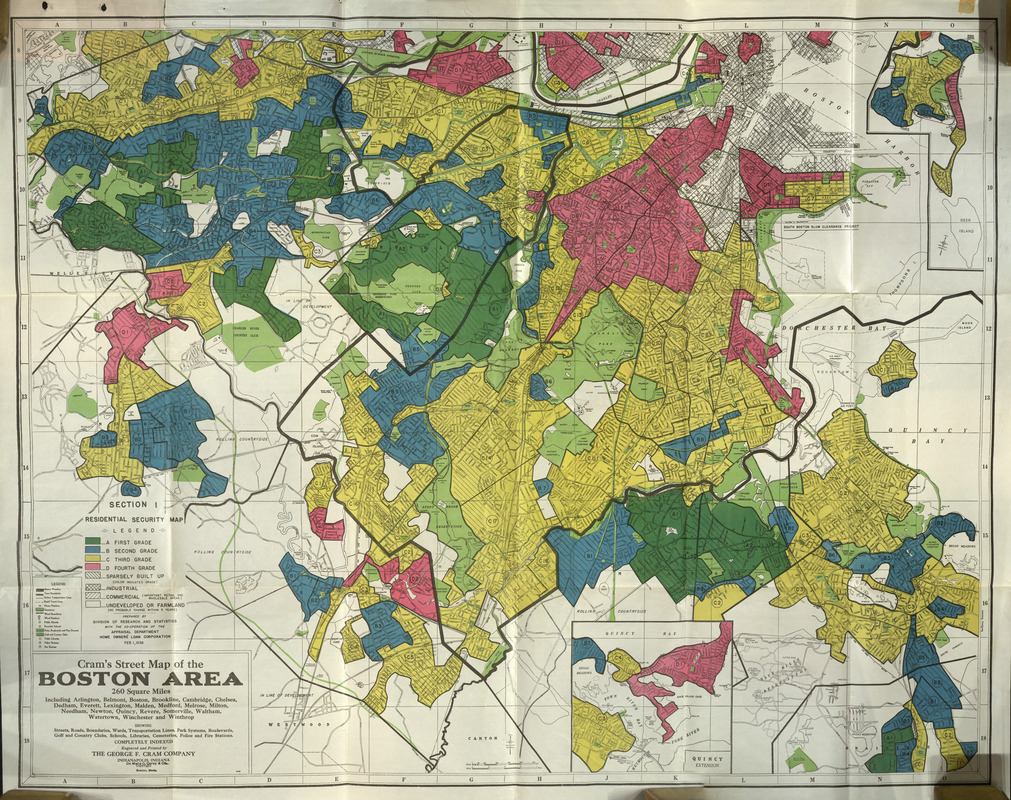
Home Owners’ Loan Corporation (HOLC)’s Residential Security Map, Boston.

Homeownership rate of non-White people, median home value, return on investment rate by HOLC Grade.

Average Treatment Effects on the Treated (D-grade neighborhood) on three housing-related measures. Error bar shows 95% CI.
Data
1) Home Owners’ Loan Corporations (HOLC) “Redlining” maps digitized by the University of Richmond’s Digital Scholarship Lab and Scott Markley. They grade the residential security by A (Best), B (Still Desirable), C (Definitely Declining) to D (Hazardous).
2) Historical Census by IPUMS’s National Historical Geographic Information System (NHGIS)
Hypothesis
There are causal relationships in these three outcomes (homeownership rate of non-White people, median home value, and Return on Investment (ROI) of homes) stemming from the grading of neighborhoods.
Method: Causal Inference
Since the datasets are observational, we apply propensity score matching and weighting methods for inferring causal estimates. We constructed matched control sets of HOLC neighborhoods using spatial adjacency. We chose the nearest control observations. For instance, the matched set of control observations of a D-grade neighborhood in Boston is near non-D-grade neighborhoods in Cambridge and Brookline.
Result
1) Homeownership of non-White people were concentrated in D-grade neighborhoods. We can see evidence of “predatory inclusion” in which the granting of mortgage loans to non-White people were more concentrated
in segregated communities. Non-White people in the D-grade neighborhoods owned approximately 10% more homes than non-Dgrades.
2) The median home value in D-grade neighborhoods is always lower than the value of homes in non-D-grade neighborhoods. The gap continued to diverge until the 2000s, after the 2000s, we see evidence that the gap a bit converged, which could be attributed to the result of subprime lending practices. In 2016, however, because of the effect of the foreclosure crisis, the gap diverged again dramatically.
3) The ROI gap was flipped to positive until the 2000s with some fluctuation but the Foreclosure Crisis rollbacked such the trend. The flip of the 2000s can be accounted for the fact that D-grade neighborhoods were slowly becoming gentrifiable for real estate developers.
Study 2: Measuring the Intervention: Cost of Housing Reparations

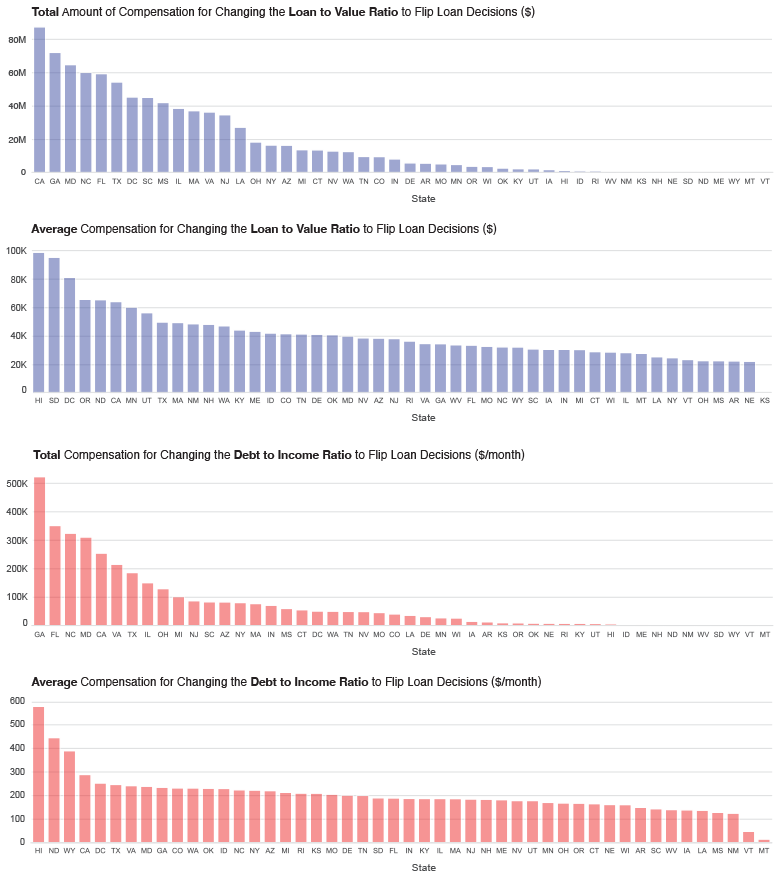
Compensation needed to flip conventional loan decisions by states. The blue bar graphs show the amount of money needed to decrease the loan-to-value ratio and the red bar graphs show the amount of money needed to decrease the debt-to-income ratio.
Data
2020 Home Mortgage Disclosure Act (HMDA) data – It has borrowers’ characteristics including loan-to-value ratio (LTV), debt-to-income ratio (DTI) and protective attributes including race and gender.
What is it for?
This study quantifies how much money would be needed in order for Black borrowers who were rejected in 2020 from a prime mortgage loan to flip the loan decision.
Method: Algorithmic Recourse
We rely on the literature of algorithmic recourse. It provides specific ways of actionable recourse if one was negatively categorized from a linear classifier by testing a grid of action sets of features. “Action sets” comprise guidelines for whether or not one can manipulate the features to flip the algorithm’s decision. We set the loan-to-value ratio and debt-to-income ratio as actionable in the context of the housing reparations program because, for instance, borrowers can improve the loan-to-value ratio by getting financial assistance from governments in the form of reparations. Then we calculated the cost to flip the decision by estimating the cost of filling the gap of each ratio if the borrower’s race was Black or African American. For instance, when a Black borrower applied a $85,000 loan to buy a property valued $100,000 with $15,000 down-payment, the loan-to-value ratio is 85%. If the actionable recourse algorithm recommends decreasing the loan-to-value ratio to 80%, then the estimated cost of assistance is $5,000.
Result
Conventional Loan (20% down payment)
- $891M to decrease LTV
- $3.6M per month to decrease DTI
- On average, $41,256 down payment assistance and $205 monthly support for the debt.
FHA Loan (3.5% down payment)
- $26M per month to decrease DTI
- On average, $578 monthly support for the debt.
So, W., Lohia, P., Pimplikar, R., Hosoi, A.E., D’Ignazio, C. (2022) Beyond Fairness: Reparative Algorithms to Address Historical Injustices of Housing Discrimination in the US. ACM Conference on Fairness, Accountability, and Transparency 2022.


